High-throughput screening processes have become an essential tool in the pharmaceutical industry and clinical laboratory.1 High-throughput screening, or HTS, is used in drug discovery2 as well as in agricultural, food, and environmental analysis.1 These applications require the development of fast and cost-effective measurement procedures.
Also important is the integration of HTS into suitable automation systems. To reduce the high costs of many reagents and storage capacity in the laboratory, the trend is toward increasing miniaturization.1 Miniaturization enables less consumption of sample, solvents, and chemicals,3 and reduces waste disposal costs.4
ICP-MS for trace metal analysis
The preservatives in industrially treated wood often contain mercury,5 cadmium, chromium, lead, and other toxic chemicals or additives.6 According to the German wastewood regulations, the upper limit allowed in wood materials is 0.4 mg/kg for Hg, 2 mg/kg for As, 30 mg/kg for Pb, 2 mg/kg for Cd, 30 mg/kg for Cr, and 20 mg/kg for Cu.7 In addition to common spectroscopic techniques such as mercury cold vapor atomic absorption spectroscopy (CV-AAS),8,9 inductively coupled plasma atomic emission spectroscopy (ICP-AES),10 and cold vapor ICP optical emission spectroscopy (CV-ICP-OES),11,12 ICP mass spectrometry (ICP-MS) is an up-and-coming analytical technique for the analysis of trace metals such as mercury.13 The technique is highly sensitive and enables rapid, multielement analysis and good interference control.14
 Figure 1 – a) Xpress vessels with a volume of 25 mL (left) and 75 mL (right). b) Turntables with 40 sample positions for Xpress vessels with a volume of 25 mL (left) and 75 mL (right).
The European and German standards DIN EN 1365715 and DIN 52161-716 recommend the use of 0.1–0.8 g of wood sample and a volume of 6–10 mL acid solution in the sample preparation of waste and wood materials using microwave digestion. In ICP-MS analysis, these values are usually applied. 13,17–19 In the current study, a multielement method for the sensitive determination of total mercury in wood material using ICP-MS was successfully miniaturized with the goal toward using it in a fully automated screening system. Sample preparation was performed using microwave digestion and three types of vessels, including different volume ranges. After validation, three real wood samples were analyzed. Finally, the results were compared with previously developed methods.20,21
Experimental
Chemicals, standards, and reagents
The following ICP standard solutions were purchased from Merck (Darmstadt, Germany): multielement standard IV with 23 elements, and single standards of mercury (Hg), lutetium (Lu) (first internal standard [ISTD]), and rhenium (Re) (second ISTD). The solutions for calibration, samples, and rinsing were prepared using ultrapure water as well as Suprapur® nitric acid (65%, v/v) and hydrochloric acid (30%, v/v) from Merck. In all validation procedures, the reference material ERM-CD100 with 0.60 ± 0.14 mg/kg Hg from the German Federal Institute for Materials Research and Testing (BAM, Berlin, Germany) was used. Finally, three real wood samples (roof beams) of different ages were analyzed.
Instrumentation and parameters
The solid wood samples were prepared using the Mars 5 microwave device from CEM (Kamp-Lintfort, Germany). CEM Xpress vessels with a volume of 25 mL and 75 mL (self-venting, no pressure limit) and XP1500 vessels with a volume of 50 mL (max. 55 bar) were used with PTFE magnetic stirrers from VWR (Darmstadt, Germany). Figure 1 shows the different vessels used in the microwave digestion. The analysis was performed with an Agilent 7700x ICP-MS from Agilent Technologies (Waldbronn, Germany) using the parameters described in Ref. 21.
The second ISTD, Re, was analyzed using the following parameters: isotopic mass 185; integration time in NoGas tuning mode 0.10 sec, and integration time in He tuning mode 0.30 sec. Re was handled like an analyte; the correction of the measurement results was performed in a manual calculation as described in the results section.
Preparation of sample and standard solutions
The wood material was split apart, dried at room temperature, and milled with the MM2000 ball mill from Retsch (Haan, Germany). All solutions for microwave digestion, calibration, and samples were exclusively arranged and stored in vessels made of polyethylene or polypropylene. The first ISTD, Lu, allowed correction of the sample introduction effects using the peristaltic pump of the ICP-MS, and was prepared in a concentration of 500 μg/L with aqua regia (5%, v/v). Re was used as the second ISTD for correcting evaporation effects during the sample preparation and was added to aqua regia in a concentration of 1.25 mg/L.
Approximately 62.5 mg of the milled sample was weighed and 2 mL of the prepared acid was added. The samples were predigested for 20 min under the laboratory hood. One blank sample was included in every digestion run. The same basic microwave digestion procedure was used for both samples for the original and miniaturized sample preparation.20,21 When cooled, the vessels were uncapped, and 1 mL of the clear sample solution was transferred to a vessel with a volume of 50 mL and filled with 11.5 mL ultrapure water. The calibration solutions were prepared in aqua regia (concentration 8%, v/v) with Hg concentrations of 0.05, 0.1, 0.5, and 1.0 μg/L, and concentrations of the other elements and the second ISTD, Re, of 5, 10, 50, and 100 μg/L. Figure 2 shows a typical mass spectrum of a standard solution.
Results and discussion
The focus of this study was to develop a miniaturized method for mercury determination in wood materials. A method comparison was done using three different types of microwave vessels. The reference material ERM-CD100 was used for the validation experiments. This included repeatability testing (intraday precision), determination of recovery rate, within-laboratory reproducibility (interday precision), measurement precision, limit of detection (LOD) and limit of quantification (LOQ), and method stability. Finally, three real wood samples were analyzed using the methods mentioned above and three different kinds of microwave vessels.
The second ISTD, Re, allows potential evaporation to be determined during the microwave digestion and therefore provides amendment of the calculated recovery rate. If there is no evaporation at all, Re concentration has to be 100 μg/L. The correction factor is calculated using the measured and the expected Re concentration, as shown in Eq. (1):
The mercury concentration can be corrected using the correction factor, as shown in Eq. (2):
Repeatability testing, recovery rate, and within-laboratory precision
Repeatability testing was performed using 25 independent samples of the reference material. All measurement results followed a normal distribution, which was verified by the David test; also, the Horwitz criterion20–22 was satisfied. In the authors’ previous studies, it was found that during microwave digestion the use of aqua regia delivered more stable results (e.g., lower standard deviations) than when nitric acid was used.20,21 For this reason, aqua regia was used as a digestion acid in all further experiments to develop a miniaturized method.
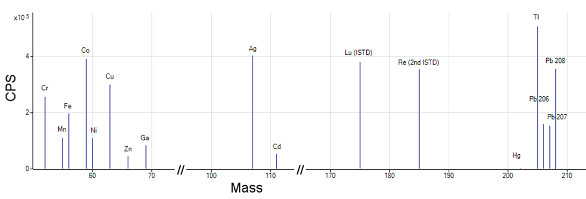 Figure 2 – Mass spectrum of a standard solution with the following concentrations: multielement standard 50 μg/L of each element, 50 μg/L of second ISTD, Re, 0.5 μg/L Hg, and 500 μg/L of first ISDT, Lu.
The results of the validation experiments were similar to the previous methods. In repeatability testing, the average values measured were between 0.48 and 0.72 mg/kg and in the expected range. The standard deviations and the resulting CV with 11.57% were slightly higher than the results achieved using the XP1500 and Xpress (volume, 75 mL) vessels. Figure 3 shows a graphic comparison of the measurement results in repeatability testing.
Table 1 – Results of repeatability testing and recovery rates for the microwave digestion method with aqua regia using three different vessel types
The recovery rates in the range of 80–120% with a mean value of 96% are in accordance with the results of the previous methods. Table 1 shows the measurement results of the repeatability testing and determination of the recovery rate. The within-laboratory precision was found using 10 samples of the reference material and one blank, which were prepared and measured on five consecutive days. The measured Hg content was in the range of 0.54–0.59 mg/kg; the average was 0.57 mg/kg and the recovery rates were between 90% and 98%.
Method stability and measurement precision
Method stability was determined with 10 samples of the reference material. After sample preparation, the solutions were divided into five parts. One was measured immediately and the remaining four were frozen at –25 °C (–13 °F) and measured on the following four consecutive days. In this experiment, the data (Hg content) were not corrected using the second ISTD, Re. The SD values were in the range of 0.01–0.02 mg/kg, and the CV between 2.10 and 3.39 mg/kg.
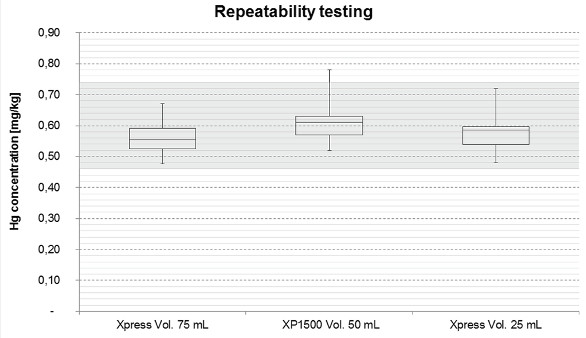 Figure 3 – Comparison of microwave digestion procedures with three different vessel types using Box-Whisker-Plots (the gray shaded area shows the interval of the expected value of the reference material).
Table 2 – Comparison of results of three real wood samples achieved with diff erent sample preparation and analysis methods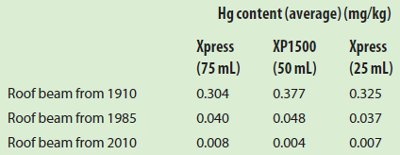
Measurement precision was determined with 10 measurements of the same sample. The uncorrected Hg content shows the following values: average 0.63 mg/kg, SD 0.01 mg/kg, and CV 1.64%. The measurement precision of Re content was: average 106.22 mg/kg, SD 1.23 mg/kg, and CV 1.15%. Finally, the resulting measurement precision of the corrected Hg content was: average 0.59 mg/kg, SD 0.01 mg/kg, and CV 0.86%.
Limit of detection and limit of quantification
The determination of LOD and LOQ was performed using 10 blank samples without any analyte. Using Eqs. (3) and (4), these values were calculated with the average measurement results (see Ref. 23):
The LOD and LOQ of the measurement solutions were 6.1 ng/L and 14.3 ng/L, respectively. For the dried wood material, the LOD and LOQ were 2.45 μg/kg and 5.73 μg/kg, respectively.
Real wood samples and method comparison
To compare the new miniaturized microwave digestion method and the adapted ICP-MS analysis method with the previous methods,21 three real wood samples were analyzed: roof beams of different ages from one building. The oldest roof beam, from 1910, contained the highest mercury content. The roof beam from 1985 had a very low amount of mercury. The third roof beam, from 2010, had a mercury value close to the LOQ. These results were confirmed with all three methods using different microwave vessels (see Table 2).
Table 3 – Sample weights and the solution volumes used in the current method and in the miniaturized method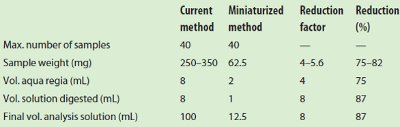
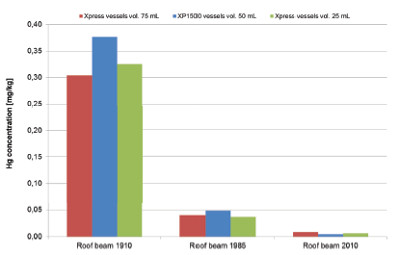 Figure 4 – Comparison of different methods with three different kinds of microwave digestion vessels using real samples.
The results achieved using XP1500 vessels, which are pressurized up to 55.2 bar, showed them to have slightly higher Hg values than the selfventing Xpress vessels. The main advantage of Xpress vessels is the ease of handling in closing and opening. The vessel construction enables automated handling, which can be adapted in a high-throughput screening procedure. The differences between the volumes of 75 mL and 25 mL are very low. Figure 4 shows a comparison of the methods.
The current method and the miniaturized method enable a maximum of 40 samples to be handled in one microwave digestion run. The required sample weight was reduced to a factor of 4–5.6, and the volume of the aqua regia solution was reduced to a factor of 4. Reduction of the solution after digestion and the fi nal diluted analysis solution was done to a factor of 8, which is a loss of 87% (see Table 3).
Conclusion
High-throughput screening procedures in environmental analysis require fast and cost-eff ective measurement techniques. ICP-MS, in combination with automated sample preparation, provide a very sensitive and fast multielement method for mercury and heavy metal determination in wastewood materials. The miniaturized sample and measurement method described enables a LOD of 2.45 μg/kg mercury in dried wood material. This is in accordance with the current methods.20,21 but the required materials, i.e., sample weight and reagents, were reduced by 75–87%. Further investigations include full integration of this method into an automated, high-throughput screening system in accordance with previous applications.24–26
References
- Chapman, T. Nature 2003, 421(6923), 661–6.
- Smith, A. Nature 2002, 418(6896), 453–9.
- Hong, J.; Miki, Y. et al. Chemosphere 2012, 88(11), 1287–91.
- Quintana, J.B.; Miró, M. et al. Anal. Chem. 2006, 78(8), 2832–40.
- Moll, F. Angew. Chem. 1913, 26(67), 459–63.
- Scharf, H.; Becker, R. et al. Accredit. Qual. Assur. 2010, 15(11), 613–19.
- Federal Ministry of Justice of Germany Waste Wood Ordinance 2002; http://www. bmu.de/fileadmin/bmu-import/files/pdfs/ allgemein/application/pdf/wastewood_ ordinance.pdf
- Zhou, C.Y.; Wong, M.K. et al. Anal. Sci. 1996, 12(3), 471–6.
- Kaercher, L.E.; Goldschmidt, F. et al. Spectrochim. Acta, Part B 2005, 60(5), 705–10.
- Jarzynska, G.; Falandysz, J. J. Environ. Sci. Health, Part A 2011, 46(6), 569–73.
- Depoi, F.D.S.; Bentlin, F.R.S. et al. Anal. Meth. 2010, 2(2), 180–5
- Wuilloud, J.C.A.; Wuilloud, R.G. et al. Spectrochim. Acta, Part B 2002, 57(2), 365–74.
- Antes, F.G.; Duarte, F.A. et al. Talanta 2010, 83(2), 364–9.
- Khouzam, R.B.; Lobinski, R. et al. Anal. Meth. 2011, 3(9), 2115–20.
- DIN EN 13657: Characterization of waste— digestion for subsequent determination of aqua regia soluble portion of elements in waste, German version of EN 13657 (2002). Beuth Verlag: Berlin, 2003.
- DIN 52161-7: Testing of wood preservatives— detection of wood preservatives in wood—part 7: determination of the content of copper bearing wood preservatives. Beuth Verlag: Berlin, 2014.
- Millour, S.; Noël, L. et al. J. Food Compos. Anal. 2011, 24(1), 111–20.
- Nardi, E.P.; Evangelista, F.S. et al. Food Chem. 2009, 112(3), 727–32.
- Ahl, H.; Fromm, J. et al. Eur. J. Wood Wood Prod. 2013, 71(4), 533–5.
- Fleischer, H.; Thurow, K. Am. Lab. 2013, 45(8), 6–9.
- Fleischer, H.; Thurow, K. Am. Lab. 2013, 45(9), 6–11.
- Horwitz, W. Anal. Chem. 1982, 54(1), 67A– 76A
- Kromidas, S. Validation in Analytics. Wiley- VCH: Weinheim, 2011; ISBN: 978-3-527- 32939-7.
- Thurow, K.; Gördes, D. JALA 2006, 11(3), 128–33.
- Fleischer, H.; Thurow, K. Amino Acids 2013, 44(3), 1039–51.
- 26. Fleischer, H.; Thurow, K. IEEE I2MTC 2013, 1624–9.
Heidi Fleischer, Ph.D., is Senior Scientist, University of Rostock, Institute of Automation, Richard-Wagner- Strasse 31, 18119 Rostock, Germany; tel.: +49 (0) 381 498 7803; fax: +49 (0) 381 498 7702; e-mail: [email protected]. Ellen Vorberg is a Ph.D. student, and Kerstin Thurow, Ph.D., is CEO, Center for Life Science Automation—Celisca, Rostock, Germany.