Even in minor concentrations, elemental mercury and inorganic and organic bound mercury can have harmful biological effects on organisms.1 Mercury and other toxic elements can enter the environment through industrial pollution2 or municipal waste,3 and may lead to dangerously high levels of exposure.1 Industrially treated wood often contains preservatives that have toxic chemicals or additives, including compounds of mercury,4 cadmium, chromium, lead, and other harmful elements or substances.5 The German waste wood regulations require a limit of 0.4 mg/kg in dried wood material.6
Today, a multitude of analytical systems and methods are used to provide sensitive determination of total mercury content. In addition to spectrophotometric7 and radiometric 8–10 determination, spectroscopic techniques include mercury cold vapor atomic absorption spectroscopy (cold vapor AAS),2,11–13 inductively coupled plasma-atomic emission spectroscopy (ICP-AES),13 and cold vapor ICP-optical emission spectroscopy (cold vapor ICP-OES).14–16 Of increasing importance is ICP-mass spectrometry (ICP-MS) due to its high sensitivity, good interference control, analysis speed, and possibility for multielement analysis.17–20
In the study presented,18 a multielement method for sensitive determination of total mercury in wood material using ICP-MS was developed. Sample preparation was performed using microwave digestion with two acid mixtures and two vessel types. After validation, 43 real wood samples of different origin and treatment were analyzed and the results were compared to spectroscopic methods such as classic and cold vapor ICP-OES.
Experimental
Standards and calibration solutions
All solutions for calibration, samples, and rinsing were prepared using ultrapure water and Suprapur® nitric acid (65%, v/v) and Suprapur hydrochloric acid (30%, v/v) (Merck, Darmstadt, Germany). The following standards and calibration solutions were also purchased from Merck: ICP multielement standard IV with 23 elements, and ICP Hg and Lu standard. The latter was used as the internal standard (ISTD). The methods were validated using the reference material ERM-CD100 from the German Federal Institute for Materials Research and Testing (BAM, Berlin, Germany). Forty-three real wood samples of different origin, age, and degree of treatment were analyzed.
Instrumentation for sample preparation and sample analysis
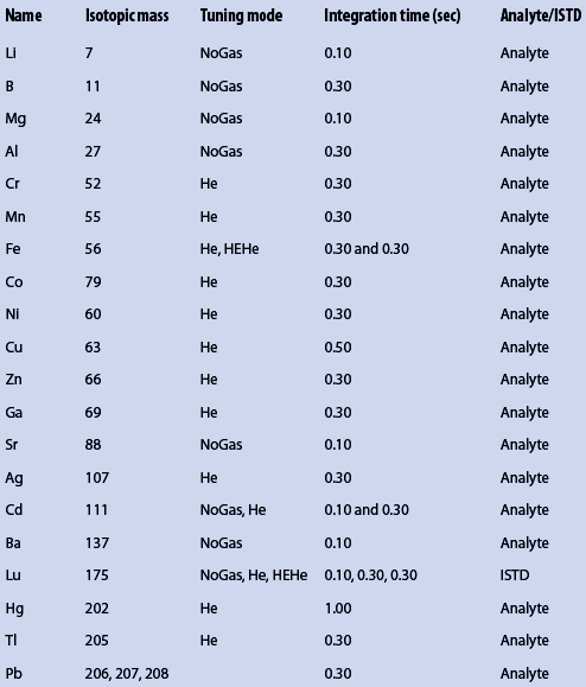
Sample preparation was performed using the Mars 5 Microwave Digestion System (CEM, Kamp-Lintfort, Germany). Two vessel types (both from CEM) were used: XP1500 vessels (vol. 50 mL, max. 55 bar) and Xpress vessels (vol. 75 mL, self-venting, and no pressure limit). PTFE magnetic stirrers from VWR (Darmstadt, Germany) were used for mixing during the digestion. Sample solution analysis was performed using the ICP-MS 7700x (Agilent Technologies, Waldbronn, Germany) with the following parameters: radiofrequency power—1550 W, sample depth—10 mm, carrier gas—0.65 L/min, nebulizer pump—0.10 rps, spray chamber temperature—13 °C (55.4 °F), and dilution gas—0.40 L/min. Argon was used as plasma, carrier, and dilution gas. In the collision cell, a helium flow was used as follows: 0 mL/min in NoGas tuning mode, 4.3 mL/min in He mode, and 10 mL/min in HEHe mode. The measurements were done with three replicates. Table 1 shows the analysis parameters for the elements analyzed. The rinse time was set to 60 sec at 0.3 rps of the nebulizer pump, followed by 30 sec at 0.4 rps. Sample introduction was performed using the ASX-500 autosampler (Cetac, Omaha, NE).
Table 1 – Elements, isotopic masses, and measurement parameters
Standard and sample preparation
At room temperature, the dried wood material was split apart and then milled using the MM2000 ball mill (Retsch, Haan, Germany). After adding 250–350 mg of sample and 8 mL nitric acid or aqua regia, the samples were predigested for a period of 20 min. One blank sample was included at every digestion run. The basic microwave digestion procedure was as follows: temperature–time ramp for 20 min with a final temperature of 180 °C (356 °F), then 20–30 min hold time at 1200 W for more than six vessels. Following this, the samples were cooled to room temperature and the vessels were uncapped. The clear sample solutions were transferred to a volumetric flask (vol. 100 mL) and filled with ultrapure water.
The calibration solutions were prepared in nitric acid or aqua regia (concentration 8%, v/v) with Hg concentrations of 0.05, 0.1, 0.5, and 1.0 μg/L and concentrations of 5, 10, 50, and 100 μg/L for the other elements. The ISTD was prepared at a concentration of 500 μg/L with nitric acid (5%, v/v). All solutions were prepared and stored in vessels made of polyethylene or polypropylene.
Results and discussion
Four microwave digestion procedures were tested using two vessel types and two acid mixtures. The reference material ERM-CD100 was used in all validation experiments to measure the Hg content. The remaining elements analyzed resulted in good calibration for the multielement determination, but their content was not considered further in this study.
First, repeatability testing (intraday precision) was performed for four digestion procedures, and the recovery rate was determined using up to 39 samples. The following experiments were done using microwave digestion with aqua regia and the XP1500 vessels: within-laboratory reproducibility (interday precision), measurement precision, limit of detection (LOD), and limit of quantification (LOQ); method stability and rinsing effects were also determined. The maximum value of the within-laboratory coefficient of variation (CV) should not exceed 11.52% according to the definition by Horwitz.21 This value was achieved in the majority of the experiments performed.
Repeatability testing, rate of recovery, and within-laboratory precision
Repeatability testing was conducted using more than 30 samples of the reference material and four microwave digestion methods: aqua regia or nitric acid in the XP1500 and Xpress vessels. All measurement results followed a normal distribution, which was verified by the David test; the Horwitz criterion was fulfilled for all methods, with the exception of the nitric acid digestions in the Xpress vessels. The results of the aqua regia methods showed slightly lower CVs than the nitric acid methods. The highest standard deviations (SDs) were measured with nitric acid in the Xpress vessels. The average recovery rates were slightly higher in the pressure-tight XP1500 vessels. The recovery rates for all methods were in agreement with the acceptable values for recovery rates (measured value was less from 100 than the fourfold of the CV), according to Kromidas.22
Table 2 – Results of repeatability testing and recovery rates for four microwave digestion methods
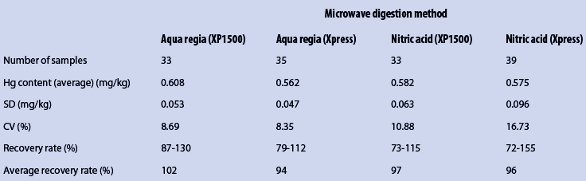
Table 2 shows the measurement results of the four microwave digestion methods; the methods are compared in Figure 1. The within-laboratory precision was determined using microwave digestion with aqua regia in the XP1500 vessels. Therefore, three samples of the reference material and one blank were prepared and measured on five consecutive days. The average values measured were between 0.56 and 0.62 mg/kg, and the recovery rates were between 93% and 102% (average 98%).
 Figure 1 – Comparison of four microwave digestion methods using Box- Whisker-Plots (the gray shaded area shows the interval of the expected value of the reference material).
Measurement precision, detection limit, and quantitation limit
Ten measurements of the same sample in aqua regia were performed to determine the measurement precision. The CV value was 1.25% and the SD was 0.01 mg/kg. LOD and LOQ were determined with measurements of 10 blank samples. These values were calculated from the sum of the blank measurement value and threefold (LOD) and tenfold (LOQ) of the SD value, respectively. For the measurement solutions, the LOD and LOQ values were 5.74 ng/L and 15.76 ng/L, respectively; in the wood samples (dried matter), the LOD and LOQ values were 2.29 μg/kg and 6.31 μg/kg, respectively.
Method stability
To determine method stability, three samples of the reference material were prepared and the solutions were divided into five parts. One was measured immediately and the remaining four samples were frozen at –25 °C (–13 °F) and measured on the following four consecutive days. The SD values were in the range of 0.01–0.02 mg/kg, the CV was 1.64–3.21 mg/kg, and the recovery rates were 94%–104%.
 Figure 2 – Measurement results: total Hg content in roof beams from different time periods.
Spectroscopic analysis of real wood samples: Method comparison
Using the ICP-MS method based on microwave digestion with aqua regia in the XP1500 vessels, 43 real wood samples of different origin were analyzed. Three roof beams from one building but from different time periods showed very interesting results. The roof beam from a house built in 1910 had an Hg content of 0.377 mg/kg. The Hg content was 0.048 mg/kg in the second roof beam, which was installed on the building in 1985. The third roof beam, from 2010, had an Hg content of 0.004 mg/kg, which is lower than the LOQ (see Figure 2).
Table 3 – Total Hg content of selected real wood samples from different origin
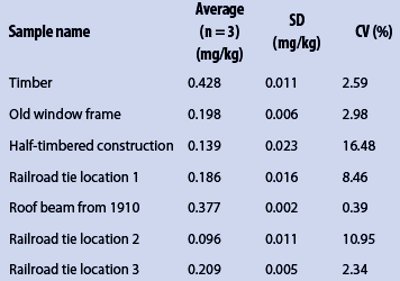
Finally, the ICP-MS-based method was compared with two spectroscopic methods using cold vapor ICP-OES and classical ICP-OES, presented in Part 1 of this article (Am. Lab. Aug 2013, 45[7], 6–9).23 The ICP-MS results for selected wood samples with significant Hg content are shown in Table 3; Figure 3 depicts the comparison between the measurements of all the methods presented in this study. The Hg contents of the samples were lower using cold vapor ICP-OES than with ICP-MS. The SD and CV values were comparable. The results of ICP-OES demonstrated relatively high CV values, because the Hg contents of the majority of the samples were lower than the LOD of the ICP-OES method. Hg analysis using ICP-MS is very sensitive. The LOD and LOQ values were comparable to those of the cold vapor ICP-OES method.
 Figure 3 – Comparison of ICP-MS, cold vapor ICP-OES, and classical ICPOES using a spray chamber for the determination of total mercury content of selected wood samples of different origin.
ICP-MS has more of an advantage for multielement analysis. Elements such as As, Pb, Cd, and Cu can be detected in waste wood using ICP-MS. With one measurement, the technique is able to analyze all elements required, which is more time-efficient.
Conclusion
A very sensitive and rapid multielement method allows for the determination of total mercury content and additional elements such as heavy metals in waste wood. A limit of detection of 2.29 μg/kg was realized using this method. In comparison to classical ICP-OES, the LOD was reduced by more than 98%; compared with cold vapor ICP-OES, the LOD was about 1 μg/kg lower. The results for wood analysis show good correlation to the results from the literature in which solids such as coal were determined using cold vapor ICP-MS.18
Sample preparation was performed using microwave digestion with two acid compositions and two types of microwave vessel. Optimal results were achieved using aqua regia in the XP1500 vessels. In seven of the real wood samples analyzed, increased mercury content in the range of 0.10–0.43 mg/kg dried wood material was found. In the samples from the surrounding environment, no mercury was detected. The method presented enables rapid determination of wood materials such as treated waste wood and natural environmental samples.
References
- Keil, D.E.; Berger-Ritchie, J. et al. Labmedicine2011, 42(12), 735–42.
- Hojdová, M.; Navrátil, T. et al. Water Air Soil Pollut.2011, 216(1–4), 73–82.
- Cheng, H.; Hu, Y. Environ. Sci. Technol.2012, 46(2), 593–605.
- Moll, F. Angew. Chem.1913, 26(67), 459–63.
- Scharf, H.; Becker, R. et al. Accredit. Qual. Assur.2010, 15(11), 613–19.
- Federal Ministry of Justice of Germany Waste Wood Ordinance 2002; http://www.bmu.de/fileadmin/bmu-import/files/pdfs/allgemein/ application/pdf/wastewood_ordinance.pdf.
- Chatterjee, S.; Pillai, A. et al. Talanta2002, 57(3), 461–5.
- Taylor, C.; Tickle, W. J. Appl. Chem.1969, 19(1), 1–7.
- Taylor, C.; Tickle, W. et al. J. Appl. Chem.1969, 19(1), 8–13.
- Taylor, C.; Hunter, G. J. Appl. Chem. Biotech.1972, 22(6), 711–18.
- Zhou, C.Y.; Wong, M.K. et al. Anal. Sci.1996, 12(3), 471–6.
- Kaercher, L.E.; Goldschmidt, F. et al. Spectrochim. Acta, Part B2005, 60(5), 705–10.
- Jarzynska, G.; Falandysz, J. J. Environ. Sci. Health Part A, Toxic/Hazard. Subst. Environ. Eng.2011, 46(6), 569–73.
- Wuilloud, J.C.A.; Wuilloud, R.G. et al. Spectrochim. Acta, Part B2002, 57(2), 365–74.
- Wuilloud, J.C.; Wuilloud, R.G. et al. J. Anal. Chem.2002, 57(9), 799–801.
- Depoi, F.D.S.; Bentlin, F.R.S. et al. Anal. Methods2010, 2(2), 180–5.
- Krachler, M.; Radner, H. et al. Fres. J. Anal. Chem.1996, 355(2), 120–8.
- Antes, F.G.; Duarte, F.A. et al. Talanta2010, 83(2), 364–9.
- Khouzam, R.B.; Lobinski, R.; Pohl, P. Anal. Methods2011, 3(9), 2115–20.
- Djedjibegovic, J.; Larssen, T. et al. Food Chem.2012, 131(2), 469–76.
- Horwitz, W. Anal. Chem.1982, 54(1), 67A–76A.
- Kromidas, S. Validation in Analytics. Wiley-VCH: Weinheim, 1999; ISBN: 3-527-28748-5.
- Fleischer, H.; Thurow, K. Am. Lab. Aug. 2013, 45(7), 6–9.
Heidi Fleischer, Ph.D., is Senior Scientist, University of Rostock, Richard-Wagner-Strasse 31, Institute of Automation, 18119 Rostock, Germany; tel.: +49 (0) 381 498 7803; fax: +49 (0) 381 498 7702; e-mail: [email protected]. Kerstin Thurow, Ph.D., is CEO, Center for Life Science Automation, Rostock, Germany.