GC-MS based pesticide residue testing in grains often results in enhanced response, with the degree of enhancement being dependent on the type of grain. Some grain matrices cause matrix interference, leading to false positives and false negatives, as well as significant limitations in limits of detection (LOD) and quantification, particularly when published multiple reaction monitoring (MRM) assays are used without validation. Matrix-matched standards and analyte protectants are used routinely in pesticide analysis to combat enhancement and suppression, and to provide a more accurate indication of the residue levels present.
Certain pesticide and matrix combinations are well known for illustrating the problems listed above.1,2 It is important to remember that published MRMs should only be used following validation to demonstrate that they are free from matrix interference in the matrix system under study.
The problem of matrix interference was examined in a variety of grains (wheat, barley, oats, field peas, chick peas, canola seeds, and soybeans) using the SCION GC-MS triple quadrupole (300 series GC) (Bruker Chemical & Applied Markets Div., CAM) (Fremont, CA). Sample preparation was minimal (2.5–5 g of grain to compensate for varied lipid content), consisting of a QuEChERS approach. GC-MS conditions were as follows: 1079 inlet with a 5-μL injection, Siltek™ Deactivated Inlet Liner (Restek Corp., Bellefonte, PA), Restek™ column, transfer line temperature of 270 °C, source temperature of 200 °C, and scheduled MRMs with two to four transitions per compound.
Pesticide residue analysis
Analyte degradation and matrix interference with GC-MS based analyses represent two key challenges in residue analysis and the drive to improve limits of detection. The use of matrix-matched standards and analyte protectants are two general approaches that have enjoyed significant success, and generally avoid the need for a standard addition approach. Matrix-matched standards have been instrumental in improving the utility of GC-MS by allowing the analysis of certain compounds that have previously been regarded as “non-GC compatible.” This has provided further confidence in identification and quantification of positives when these compounds are screened using both GC- and LC-based analyses. The use of stable isotope dilution, while providing excellent results, represents a very costly and unsustainable alternative for large-scale multiresidue analysis of food.
Matrix matching
In this study, GC-MS analysis of whole grain as well as end-of-season grain dust was undertaken in order to demonstrate the necessity for matrix-matched internal standard sets rather than a single internal standard. The purpose behind the dust analysis per se was to determine if it was fit to be used for animal feed or whether it would be used for biofuel processing. This posed a rather challenging problem because the composition of the grain dust was unknown, and there was often a 300–400% variation in the internal standard response, depending on the origin of the grain dust samples.
An early decision was made to use matrix matching to evaluate matrix interferences on a compound-by-compound and matrix-by-matrix approach and elucidate the causes of false positives, false negatives, and compromised LOD. With matrix matching, the authors were put in a better position to determine the limitations of the methodologies and to ascertain the LOD.
Signal enhancement
With GC-MS, there is usually some beneficial signal enhancement because the matrix protects the pesticides and enhances their transfer from hot vaporizing inlets, reducing thermal stress and masking active sites. Not every compound displays signal enhancement because they are either thermally/chemically stable or have limited adsorption potential. Equally, signal enhancement is not seen with every matrix and some matrices do not provide any significant protection effect at all. In this study, specific grains contained up to 50% lipids by mass and thus have enormous potential for protection effects.
The degree of signal enhancement was dependent on the inlet type. The approach for this study was to deactivate the inlet system to obtain an optimal inert flow path. Various liners were tested, and it was determined that Siltek Deactivated Inlet Liners were the best option for the 1079 inlets. A significant difference in signal enhancement was seen with both the split/splitless and the programmed temperature vaporizer (PTV)-type inlet. Being aware of these variables allowed the false-positives issue to be addressed.
Signal loss
False negatives and signal loss are usually caused by differences in matrix types. A good example of this is canola. In this study, canola was also analyzed using chemical ionization (CI), but this did not solve the problem because the signal for one target compound was lost and artifact peaks dominated. The cause of signal loss in this case was probably matrix binding of the compounds.
Matrix interference comparison
For this study, the standard matrix-matched calibration curve included a concentration range of 40–1 ppb for the 5-g samples and 80–2 ppb for the 2.5-g samples. The matrix-matched standards originated from organic wheat, barley, and chick peas, and organic canola grown specifically for this project. Blank matrix solution was generated by using the same QuEChERS protocol used for real samples. All matrix-matched standards were prepared by diluting custom mixtures with matrix solution. Typically, 20 mL of blank matrix was generated at a time and stored in a –80 °C freezer until used (shelf life of two weeks once thawed). All the pesticide standards were custom mixes made by ULTRA Scientific (North Kingstown, RI), with seven custom mixtures combined to produce a stable standard mixture.
Simazine matrix interference
Simazine, an herbicide from the triazine class that is used to control broad-leaved weeds and annual grasses, acts by inhibiting photosynthesis; its use has been banned in many countries. Simazine is closely monitored because it is retained in the soil for 2–7 months following first application and its entry into water supplies can cause human health problems.3
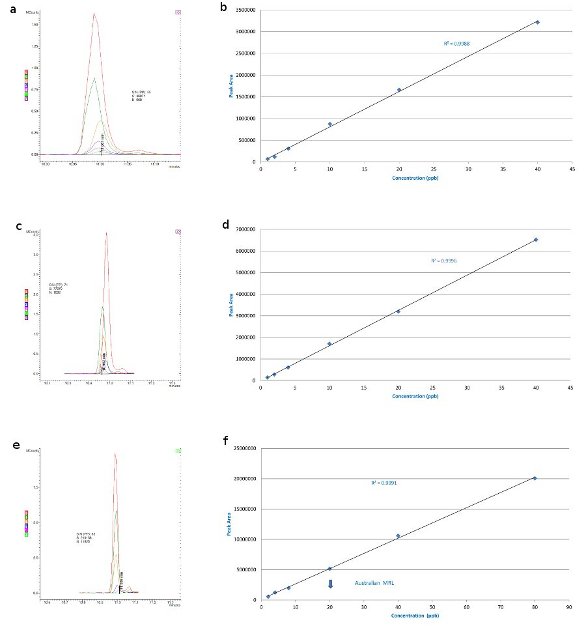
Figure 1 - Simazine: 40, 20, 10, 4, 2, and 1 ppb in a) barley matrix overlaid with matrix blank, b) barley matrix-matched standards, c) wheat matrix overlaid with matrix blank, d) wheat matrix-matched standards, e) canola matrix overlaid with matrix blank (S/N for 4 ppb), and f) canola matrix-matched Australian standards (maximum residue limit, MRL, 20 ppb).
Figure 1a shows an overlay of the 40, 20, 10, 4, 2, and 1 ppb calibration injections for simazine in barley matrix overlaid with a matrix blank (the flat line at the bottom is the matrix blank). There is no significant interference and the standard curve (Figure 1b) goes down to 1 ppb. The level of detection could be more sensitive and lower levels could be detected, but this gives an example of a situation in which the matrix is not an issue. Wheat shows a similar effect (Figure 1c and d), and again there is a flat line for the matrix, showing no interference even at 1 ppb with a S/N of 71; thus, lower detection limits can certainly be achieved.
Canola, with its high lipid content, gives a maximum detection limit of approx. 4 ppb (Figure 1e and f), but this is still well below the Australian Standard MRL of 20 ppb. At 4 ppb with a S/N of 18:1, it could be more sensitive and go a little lower, but can still satisfy the U.S. EPA drinking water requirement.3
Malathion matrix interference
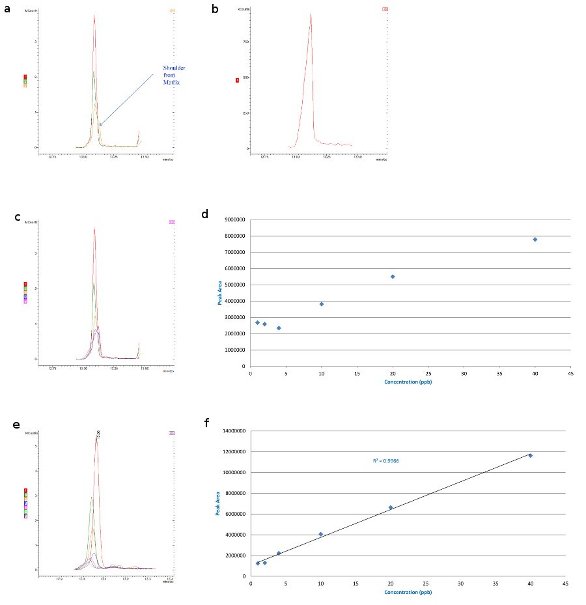
Figure 2 - Malathion matrix interference: 40, 20, and 10 ppb in a) barley matrix overlaid with matrix blank (shoulder from matrix), b) barley matrix, c) barley matrix overlaid with matrix blank, d) barley matrix-matched Australian standards (MRL, 8 ppm), e) wheat matrix overlaid with matrix blank (small interference), and f) wheat matrix-matched Australian standards (MRL, 8 ppm).
Malathion is an organophosphate insecticide of relatively low human toxicity that is used widely in mosquito and boll weevil eradication programs.4 The maximum amount of malathion residue allowed by the U.S. FDA and U.S. EPA on crops used as food is 8 ppm.5 The matrix effects of malathion on various grains were examined using GC-MS techniques. The malathion in barley matrix displayed a slight shoulder from the matrix on the 10-ppb trace (Figure 2a). In the malathion 40–4 ppb trace overlaid with the blank matrix in barley, there is clearly huge potential for matrix interference (Figure 2c). Effectively, the interference level equates to 4 ppb; even if analyte protectants were used, interference would still occur.
With malathion in wheat, the interference is much smaller (Figure 2e); the level of detection is down to 2 ppb, as shown on the standard curve (Figure 2f). There is still a very slight interference, but it is not as pronounced as in the barley sample.
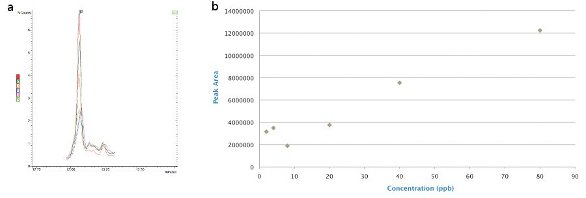
Figure 3 - Malathion: 80, 40, 20, 4, and 2 ppb in a) canola matrix overlaid with matrix blank (matrix interference at equivalent level 20 ppb), and b) matrix-matched standards.
The interference with respect to malathion in canola does represent a problem, with extracted lipids contributing to the signal at a level of 20 ppb (Figure 3a and b), lowering the effective limit of detection. There is potential to do some cleanup on the QuEChERS extracts to slightly improve this problem, but 20 ppb is effectively the best current level of detection.