The carbon pool in soils consists of both organic and inorganic carbon. Determinations of their contents in soils are routine in this field, especially when there is high interest in the soil organic carbon pool and its stabilization behavior in the context of carbon dioxide emissions. Common methods for determining carbonate contents are gas-volumetric approaches, elemental analyses of carbon contents after combustion of organic material for 4 hr, and the pressure calcimeter method by Sherrod et al.1
A method that allows determinations of both parameters (organic carbon and carbonate) synchronously would save time and resources. In a previous study,2 the potential of mid-infrared spectroscopy was tested for carbonate and organic carbon determinations. A large and diverse data set of Austrian forest soil samples was investigated with this method to assess the applicability of mid-infrared spectroscopy for carbon determinations in soils. It was found that calculated models for organic carbon, which were based on areas of infrared bands, performed better in mineral soils than in all samples (organic layers and mineral soils). Partitioning into groups having less diverse chemical backgrounds would increase the performance of the models for organic carbon. For carbonate determinations, the correlations were high, even for the total sample pool having an R2 of 0.960.2 The aim of the present study was to evaluate the potential to enhance the performance of the models by group separations with respect to carbonate determinations. For the organic layers, in particular, these effects were expected to be quite high.
Experimental
Soil sampling
Table 1 - Numbers of samples (n) for the calculated models together with ranges of basic parameters (organic carbon, Corg, total nitrogen, Nt and carbonate, all in mg per g) of the investigated forest soil samples
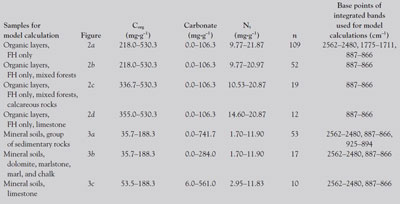
Soil samples from 139 Austrian sites were provided from the BioSoil project.3 Ranges of basic parameters (contents of organic carbon, carbonate, nitrogen, and phosphorus) of the investigated soil samples are provided in Table 1. Three pits were excavated per location; the material from the humus (Corg > 20%) and topsoil (Corg < 20%) layers (if present, these were: undecomposed litter [L], mixed samples of F [intermediate decomposed organic matter], and H [highly decomposed organic matter] [FH] upper mineral soil layers: 0–5 cm and 5–10 cm) was air dried and sieved (2 mm). Subsequently, small amounts of the samples were powdered in an agate mill. The soils were stored in airtight bottles. Details of the BioSoil project such as soil sampling can be found in Ref. 3.
Carbonate determination
Approx. 0.5–2 g of dry soil samples were treated with 10 mL of 10% HCl (which is a concentration of 2.86 M) after connecting to the Scheibler apparatus. Released CO2 was measured volumetrically. The apparatus was calibrated with pure CaCO3, which was treated in the same way.4
Elemental analyses
Total carbon and total nitrogen in bulk soil samples were measured by combustion at 1250 °C in a CN 2000 (LECO, St. Joseph, MI). Carbon dioxide was formed after thermal dissociation of carbonates and oxidation of the organic compounds. Organic carbon was determined by subtracting the inorganic carbon content (from the carbonate determination) from the measured total carbon.5
FTIR analyses
Potassium bromide pellets were prepared for the transmission mid-infrared spectroscopy. The full weight of each pellet was 200–201 mg. A 0.5-mg analyte was included for the L and FH layers and 1.5 mg for the mineral soil samples from 0 to 5 and 5 to 10 cm. The exact weights of analyte per pellet were noted for evaluations of the obtained spectra. The spectra were recorded with a Paragon 500 FTIR spectrometer (PerkinElmer, Shelton, CT) in the mid-infrared area (4000–400 cm–1). The recording of the mid-infrared spectra was carried out with a resolution of 4 cm–1, weak apodization, and 16 scans per sample. Background correction against ambient air and pure KBr was carried out at least every 3 hr. Band areas were integrated with corrected baselines (this was done manually in Spectrum v2.00 software [PerkinElmer]; the base points for band integrations are given in Table 1); the obtained units were absorbance units multiplied by wavenumbers (AU cm–1). These band areas were normalized by dividing the band area by the weighed amount of analyte in the pellet, resulting in the unit AU cm–1 mg–1. The values were taken for the calculations with partial least squares (PLS) regression. The verification of signal stability was verified by measuring three almost identical pellets of lignin (organosolv, Sigma-Aldrich, St. Louis, MO) at least one time per series of measurements. For organic layers, 20 bands were detected and evaluated for the model calculations, and 15 bands were evaluated for mineral soil samples. Base points of the integrated mid-infrared bands that were selected for calculated models are provided in Table 1. Detailed band assignments can be found in a previous work.2 The bands selected for the calculated models were assignable as follows: 2562–1480 cm–1: carbonate; 1775–1711 cm–1: C=O stretching vibrations; 925–894 cm–1: C–H deformation of aromats, cyclopentane rings; and 887–866 cm–1: carbonate.
Statistical analyses
For model calculations, the baseline-corrected integrated band areas of the measured spectra (without any preprocessing such as smoothing or derivates) were exported to Microsoft® Excel™ (Redmond, WA), together with the results of elemental analyses and site characteristics. Calculations of partial least squares were done using PASW Statistics 18 software (PASW is Predictive Analysis Software, formerly known as SPSS, IBM, Armonk, NY). The models were calculated for linear regression, and a stepwise selection of bands contributing significantly to the performance of the models was performed. The obtained coefficients of the models were exported and applied in Microsoft Excel for calculations of the partial least squares data sets.
Results and discussion
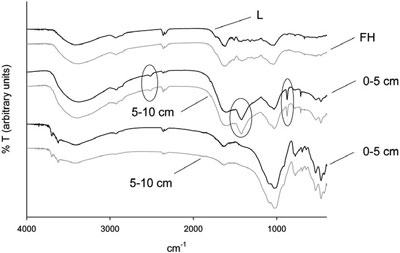
Figure 1 - Typical mid-infrared spectra of an occasionally selected carbonate containing forest soil site (Steinberg in Tyrol). The organic layers (L and FH) clearly show more bands than the mineral soils (0–5 and 5–10 cm). The carbonate bands are highlighted. For comparison, carbonate-free mineral soils from another forest site are presented in the bottommost spectra (site: Waldhams, Lower Austria). (Reproduced with permission from Ref. 2.)
Figure 1 gives examples of recorded mid-infrared spectra with three highlighted bands assignable to carbonate. Table 1 provides the ranges of the basic data of the investigated soil samples—organic carbon, total nitrogen, and carbonate—and the number of samples of each calculated model. In previous work,2 models were presented for carbonate in all investigated soil samples having an R2 equal to 0.960. Further, the coefficients of determination were 0.970 for a separated group of mineral soils (n = 277) and 0.680 for organic layers (n = 162).2 When calculating organic carbon, it was found that the chemical diversity of the soil samples seems to play a key role in applicability of mid-infrared spectroscopy, which is visible in constantly increasing R2s for separated groups of forest and tree species.2