Thermal methods such as differential scanning calorimetry (DSC) and modulated temperature DSC (MDSC), thermogravimetric analysis (TGA), thermomechanical analysis (TMA), and dynamic mechanical analysis (DMA) are well-established techniques for characterizing the morphology and composition of polymers. It is often possible to identify and quantify materials by reference to their characteristic transition temperatures and thermal stability. However, a serious limitation of conventional thermal methods is that they give only a sample-averaged response and cannot provide information on specific features on or within the sample. A DSC measurement, for example, may indicate the presence of more than one phase, but the technique cannot generally give any information regarding the size or distribution of phases. This particularly impacts scientists in the field of polymer blends (where the blend morphologies are crucial to determining their material properties), coatings (where imperfections such as gel formations can seriously impact performance), and composites.
To address this problem, Reading et al. developed a technique1 using a thermal probe to perform the heating very locally on the sample to obtain the local thermal response instead of heating the whole sample to obtain a sample-averaged response. Two recent developments have transformed the field of local thermal analysis (LTA). The first is the breakthrough in the fabrication of nanoscale thermal probes optimized for atomic force microscopy (AFM) by Prof. William King of the University of Illinois (Urbana).2 These probes have enabled local thermal analysis to attain sub-100-nm resolution in conjunction with an AFM. The second is the coupling of LTA to an optical microscope, which is a fully automated and easy-to-use tool that promises to take LTA to routine/QC applications where the spatial resolution requirements are at the micron scale and hence do not need the sophistication or expense of an AFM. Each is discussed below.
AFM-based sub-100-nm LTA
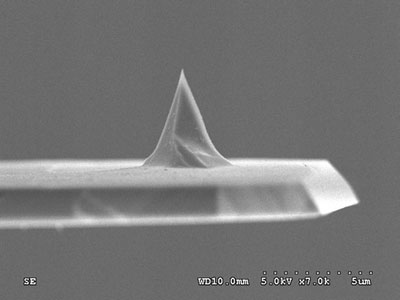
Figure 1 - Nanoscale thermal probe.
Figure 1 shows the nanoscale thermal probe, which has a tip diameter of 50 nm (comparable in size to conventional AFM probes) and was hence a 100× improvement in resolution over etched Wollaston wire probes used for microthermal analysis.3 For his thermal probe breakthrough, Prof. King was named by MIT’s (Cambridge, MA) Technology Review to the TR-35 as one of the 35 most significant scientific breakthroughs of 2006. The probes are sold commercially by Anasys Instruments (Santa Barbara, CA) as part of its nano-TA system, which interfaces to most commercially available AFMs, enabling them to perform LTA at sub-100-nm resolution.
Technique
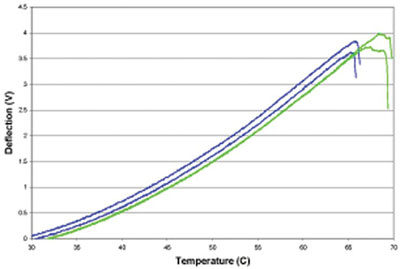
Figure 2 - nano-TA data.
A conventional AFM tip is replaced by the thermal probe that incorporates an embedded miniature heater near the end of the cantilever. The temperature of this probe is controlled by the nano-TA controller and software. The probe permits a surface to be visualized at nanoscale resolution with the AFM’s routine imaging modes, which enables users to select the spatial locations at which they would like to investigate the thermal properties (Tg, Tm) of the surface. The user then obtains this information by applying heat locally via the probe tip and measuring the thermomechanical response. The example of the thermal data shown in Figure 2 is of the probe cantilever deflection (while in contact with the sample surface) plotted against probe tip temperature. This measurement is analogous to the well-established technique of thermomechanical analysis. Events such as melting or glass transitions that result in the softening of the material beneath the tip produce a downward deflection of the cantilever. This overcomes one of the big problems facing AFM users, i.e., they have very limited ways to identify features on the sample they are imaging using any quantitative means.
One potential concern using this technique is that the smaller probe size makes the contact pressure using nano-TA around 10 MPa (two orders of magnitude higher than the contact pressure using bulk TMA). This increase in contact pressure and the nanoscale contact radius give rise to questions regarding the concept of traceability to the bulk measurements. This does not necessarily mean that local and bulk measurements will or should agree, since the thermal effects at the nanoscale could have their own dynamics. In order to understand these aspects and facilitate the adoption of this technique, recent work has been performed to understand the correlation between bulk techniques and the nano-TA measurements.
Calibration
Traditional metal calibration standards cannot be used since heat diffusion due to high thermal conductivity means that local probes cannot heat metals fast enough to cause melting. Organic crystals are difficult to prepare in smooth enough form to be readily useful, and some materials may have safety issues. Hence, semicrystalline polymer melting standards are used for calibration because they can be prepared as pressed or extruded films. Three materials covering the range from 50 °C to 250 °C are polycaprolactone (PCL), high-density polyethylene (HDPE), and polyethyleneterephthalate (PET). These are provided as thin film samples by Anasys Instruments, and the onset melt temperature has been measured using a DSC as the reference temperature for the nano-TA calibration.
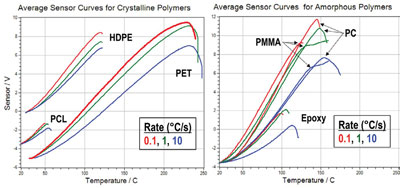
Figure 3 - Deflection curves for semicrystalline materials (left) and amorphous systems (right).
Figure 3 depicts heating rate-dependent deflection curves for these semicrystalline materials (left) and additional amorphous or thermoset systems (right). The curves in Figure 3 show deflection of the cantilever due to expansion of the surface underneath the probe until the material yields under the contact pressure through the transition. Each curve in the plot is an average of 3–5 measurements. Heating rates span two orders of magnitude, from 0.1 °C/sec (bridging typical TMA and DSC rates) to 10 °C/sec. The small thermal volume of the probe makes very high heating rates (of up to 10,000 °C/sec) accessible. In general, the crystalline materials have onsets that are relatively invariant to heating rate, while the amorphous materials show greater rate dependence as the onsets move to higher temperatures at higher rates. This is as expected for a softening or glass transition of amorphous material.
Comparison of nanoscale LTA to DSC and TMA measurements
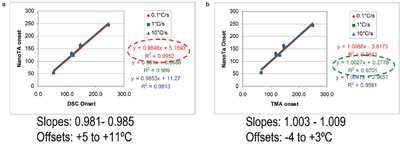
Figure 4 - a) Comparison to DSC; b) comparison to TMA.
In Figure 4a, the plots provide a least-squares fit of the LTA onset measurements obtained at the three heating rates to the DSC onset values obtained at 10 °C/min. All the fits are good, with correlation coefficients exceeding 0.99. The LTA measurements tend to have positive offsets at all rates relative to the DSC onset measurement. Using a slope and minimum offset criteria, the best correlation of LTA to DSC is for the onset obtained at the lowest heating rate, 0.1 °C/sec.
In a similar fashion, the LTA results are compared with the TMA onset measurements in Figure 4b. This plot provides a least-squares fit of the LTA onset measurements obtained at the three rates to the TMA onset values obtained at 5 °C/min. Again, the fits are very good, with correlation coefficients exceeding 0.96. The LTA measurements tend to have slightly negative offsets at all rates relative to the TMA onset measurement obtained at 5 °C/min. Using slope and minimum offset criteria, the best correlation of LTA to TMA is for the onset obtained at a heating rate of 1 °C/sec. As can be seen from the data, the correlation is good between bulk techniques and the LTA technique. The offsets of the LTA data relative to the bulk methods suggest that there is something perhaps more subtle about the LTA response. In the case of the DSC, LTA seems to respond at a higher temperature than DSC.