The design of fluorescence microscopes and selection
of dyes are better served by the knowledge of environmental
effects on dyes, whether they are in vitro
or in vivo. All significant factors are related in the
sense that the environment around the dye is being
modified and, depending on the extent of environmental
changes and type of changes, the shift in
optical properties can be dramatic.1–3 This presents
a major challenge when one attempts to image multiplexed
signals to obtain quantitative information.
In assays, it is critical to be able to understand and
control these environmental influences in order to
provide accurate analytical quantitation.4,5
In most studies, scientists rely on optical properties
reported in the literature that were usually
measured in a particular solvent. Little if any consideration
is given to the above-mentioned environmental
effects unless the study itself is being
conducted to define the environment. For example,
4′-6-diamidino-2-phenylindole (DAPI) is
used routinely to stain nuclei in cell-based assays
or tissue samples. Usually, a UV laser at 355 nm
or 375 nm is used to excite DAPI, although UV
lasers are expensive and UV fiber couplers are not
readily available. The filter set selection is generally
based on in-solution spectra.
Photon collection efficiency
A high-level process map for photon collection efficiency
(PCE) is depicted in Figure 1. The PCE transfer
function can be defined as:
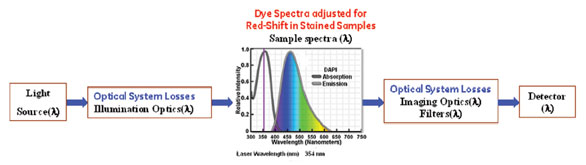
Figure 1 - Process map and main factors affecting photon collection efficiency. The study was focused on the environment-induced
change in Stokes’ shift value (a.k.a. red shift) in biological samples.
PCE = ∫ [light source (λ)] * illumination optics (λ) *
sample spectra (λ) * filters (λ) * detector ((λ) dλ~/∫
[light source (λ)] dλ
For fluorescence imaging systems in general, all of the
above factors are significant and should be taken into
account. Vendors of these systems usually provide
spectral characteristics of the light source and detector.
However, stained sample spectral properties are not
readily available; thus engineers and scientists often
rely on dye properties from a reagent catalog or a publicly
available database (www.photochemcad.com).
The latter is measured in solution. Ignoring spectral
red shift in the samples may lead to suboptimal hardware
design because exciting the fluorophore at a lower
absorption value has a lower probability of producing
a fluorescent photon than excitation near its peak
absorption. Furthermore, collecting fluorescent photons
with a bandpass filter outside of the dye emission
peak exacerbates the problem. A filter wheel allows
users to employ application-specific filters. Unfortunately,
illuminator modification can be costly after an
excitation source is selected.
Experimental
Materials and methods
A variety of cell cultures stained with commonly
used dyes were investigated. For example,
HCT116 cell cultures on microscope slide substrates
(75 × 25 × 1 mm) (Corning, Corning,
NY) were investigated; the cells were grown on
polylysine (PL)-coated coverslips and stained
nonspecifically with a Cy5-coupled secondary
antibody at three different dilutions of antibody
(1:100, 1:300, and 1:1000) in a phosphate-buffered
saline (PBS) buffer sealed with rubber
cement. PL controls were used in the spectroscopic
measurements.
Accurate analysis of histopathologic tissue samples
is important in molecular imaging. A variety of
stained tissue slides were interrogated for spectral red
shift, e.g., breast and colon tissue samples (Figure 2)
labeled with β-catenin and Cy dyes (GE Healthcare,
Piscataway, NJ).
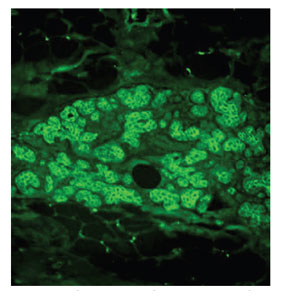
Figure 2 - Fluorescent image of Cy3-β-catenin-stained
breast tissue section, original magnification 20×.
Images of Cy5- and Cy3-stained gels on polyvinylidene
fluoride (PVDF) membrane were
analyzed. Cy dye and Alexa Fluor®-labeled oligo
microarrays (Invitrogen, Carlsbad, CA) (Figure
3) were studied earlier. Commercial fluorescence
microscopes and scanners were used,
including INCell and Typhoon (both from GE
Healthcare), Axio (Carl Zeiss, Thornwood,
NY), as well as a benchtop confocal scanning laser microscope.
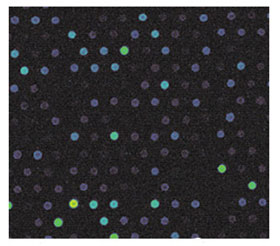
Figure 3 - Image of a fragment of Cy3-labeled microarray
(pseudocolor), 45-μm spot diameter.
The fluorescence measurements were made to
accommodate a wide range of light wavelengths
and samples mounted on different substrates.
Laser-induced fluorescence excited by R, G,
and B lasers was analyzed first using a portable
spectrophotometer. For greater accuracy, it was
subsequently replaced with a model FS 900 spectrofluorometer
(Edinburgh Instruments Ltd., Livingston,
U.K.). The latter system corrects for the
spectral responses of the xenon–arc lamp, monochromators,
and photomultiplier tube (PMT), and
has an excitation–emission mapping capability.
Some data sets were replicated on a Fluorolog®-3 spectrofluorometer (Jobin Yvon, Edison, NJ) and
were found to be in good agreement.
Results and discussion
Figure 4 shows measured and catalog emission spectra
for DAPI-stained sample. The data were corrected for
variation of incident illumination power and normalized
to a common vertical scale. The emission spectrum
in the sample (curve 1) exhibits a significant shift to the
red relative to the in-solution spectra (curve 2), as well
as a noticeable change in peak shape. The red shift can
be rationalized in terms of the large change in polarity
and polarizability of the fluorophore environment. The
peak shape change is most likely due to nonspecific
attachment on the substrate surface and in the media.
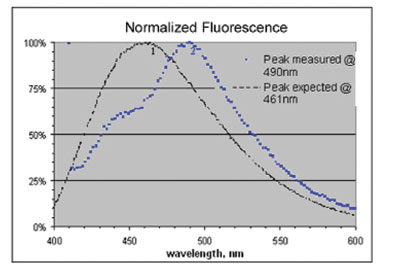
Figure 4 - Normalized fluorescence emission spectra of DAPI dye in-solution (curve 1) and in a stained breast tissue (curve 2). Emission peak red-shifted by 29 nm.
It is worth noting that the Hoechst-stained sample
exhibited different spectral behavior with a smaller
emission red shift and a 50% lower quantum efficiency
than DAPI, all other conditions being equal
(see Table 1). Both dyes are used to stain nuclei, but
it is expected that DAPI samples will look brighter
under 405-nm excitation.
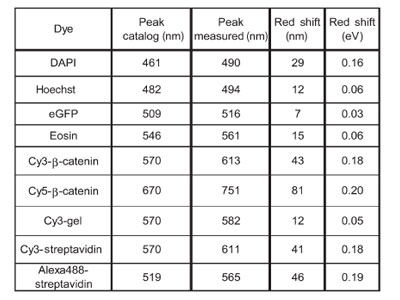
Table 1 Emission peak maximum: measured in the samples
and catalog (in-solution) values
An emission peak red shift of 5–8 nm was typical
for the enhanced green fluorescent protein
(eGFP) samples the authors studied. This is good
news, because a new 473-nm blue laser module
can be used as well as a 488-nm standalone laser in
an eGFP fluorescent channel.
Eosin-stained tissue spectra were analyzed, and a
15-nm emission red shift was present. While the value
was consistent across all three slides, a larger sample
size is needed to draw a conclusion due to a broad
emission peak and known batch-to-batch variability.
A strikingly high value of emission peak shift was
observed in tissue samples labeled with Cy-dye β-catenin (Figure 5). This shift was accompanied by
considerable peak broadening, believed to be from
a nonspecifically bound dye–conjugate in the tissue
and on the substrate.
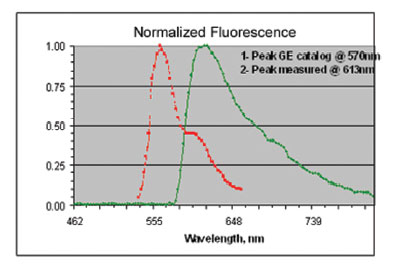
Figure 5 - Normalized fluorescence emission spectra of
Cy3-β-catenin in-solution (curve 1) and in a stained breast tissue
(curve 2). Emission peak red-shifted by 43 nm.
Red shift was encountered and analyzed in streptavidin–Cy dye-labeled microarrays during CodeLink BioChip
(Applied Microarrays, Tempe, AZ) development. The
effect was significant and exhibited the same magnitude
for Cy dyes (Figure 6) and Alexa dyes (not shown), and
varied depending on the substrate type, similar to the
results demonstrated in Ref. 3. Smaller values of red shift
were observed for Cy dye-stained gels on membrane.
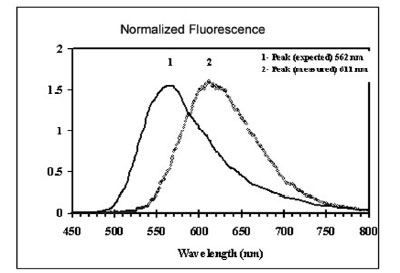
Figure 6 - Normalized fluorescence emission spectra of
streptavidin–Cy3 conjugate (curve 1) and on oligo microarray
spotted on a glass substrate (curve 2). Emission peak red-shifted
by 49 nm.
Table 1 summarizes the salient value of the emission
spectra described above. Red-shift values in nm were
converted to eV (E = h*c/λ) and the values varied from
0.01 to 0.2 eV. How much does it affect the transfer
function (*)? Computing the integral (*) is a straightforward
job, though quite tedious. The transfer function
values were estimated using Microsoft® Excel
(Redmond, WA), although the authors adopted high-throughput
tools such as PhotochemCAD (Carnegie
Mellon University [Pittsburgh, PA] and North Carolina
State University [Raleigh, NC]) and Curve-O-matic
(Omega Optical, Brattleboro, VT). The former is a spectral
database with a built-in feature to search for peak
maximum; the latter allows the plotting of dye spectra
using a selected excitation source. The transfer function
values with and without spectral red shift are summarized
in Table 2. Quantum efficiency of the detector is factored
in, while optical transmittance of the illuminator and
objective assumed constant within the 40-nm bandpass.
A 40-nm emission bandpass filter is centered on a wavelength
corresponding to the peak emission in solution or
in the sample (the adjusted values are in brackets).
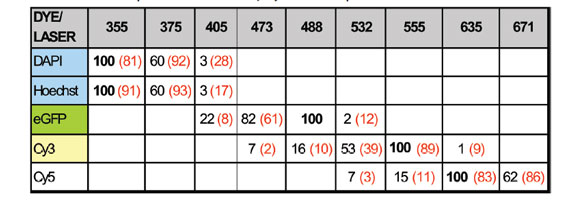
Table 2 Calculated photon collection efficiency adjusted for absorption and emission red shift
Summary and conclusion
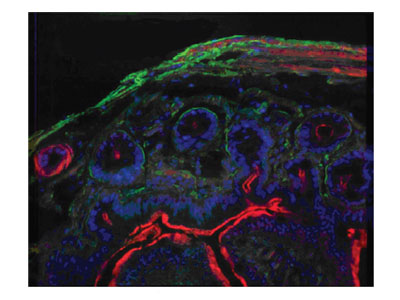
Figure 7 - Three-color image of a gut tissue section on glass
substrate. Nuclei: Hoechst dye excited with 405-nm laser,
490/40 bandpass filter; laminin: Cy3 dye excited by 532-nm
module, 580/40 bandpass filter; actin: Cy5 dye excited by
671-nm module, 700/40 bandpass filter.
Important improvements to fluorescence microscope
hardware include:
- A low-cost 405-nm laser that can replace more expensive UV lasers in the DAPI channel; the 405-nm laser is better suited for fiber optic-coupled illumination than UV lasers
- In an eGFP channel, a 473-nm laser can replace a 488-nm laser without sacrificing efficiency
- In a Cy3 channel, a 555-nm laser can increase PCE up to 50% compared to a 532-nm laser; a 671-nm laser can be used with Cy5 and Alexa 647 dyes with the same effectiveness as a 635-nm laser.
Figure 7 illustrates experimental results that support
the following conclusions: Cell nuclei tagged with
Hoechst (blue) were excited by the 405-nm laser,
Cy3 dyes were excited by the green 532-nm laser, and
Cy5 dyes (red) were excited by the 671-nm laser.
References
- McRae, E. J. Phys. Chem.1957, 61, 562–72.
- Matyushov, D. J. Phys. Chem.A2001, 105, 8516–32.
- Gaigalas, A. Bio Techniques2005, 38(1),127–32.
- Potyrailo, R.A.; Golubkov, S.P.; Borsuk, P.S.; Talanchuk, P.M.; Novosselov, E.F. Analyst 1994, 119, 443–8.
- Gupta, R.; Mozumdar, S.; Chaudhury, N.K. Biosens. Bioelectron. 2005, 21, 549–56.
Dr. Barash is a Physicist; Dr. Fomitchov is Staff Engineer;
Dr. Filkins is Instrumentation Engineer; Mr. Mayers is Optical
Engineer; Dr. Sood is a Chemist; Dr. Potyrailo is Principal
Scientist; Dr. Xia is a Physicist; and Dr. Montalto is Manager,
Molecular and Cell Biology Lab, GE Global Research, One
Research Cir., KWC285, Niskayuna, NY 12309, U.S.A.;
tel.: 518-387-7407; e-mail: [email protected]. The
authors thank various GE colleagues for providing high-quality
samples and for graciously allowing use of their equipment.