Screening for the interaction of small molecules with proteins is usually carried out by indirect methods by means of artificial labels or reporter systems. Often, the protein and/or the small molecule are labeled, e.g., by a fluorescent molecule. In these cases one can never rule out an influence of the usually bulky label on the result. On the other hand, time-resolved Fourier transform infrared (FTIR) spectroscopy can monitor interactions of small molecules with proteins label-free.1 Further, most reporter systems provide only very limited information on the interaction, whereas time-resolved FTIR can often specify the interaction: Absorbance bands can be assigned by isotopic labeling or site-directed mutagenesis and thus the interaction can be assigned to specific groups. This information can be of aid in developing drugs that interact specifically with a protein in a molecular therapy for personalized medicine.
GTPases are molecular switches that control multiple cellular functions by cycling between an active guanosine triphosphate (GTP)-bound state (“on” state) and an inactive guanosine diphosphate (GDP)-bound state (“off” state).2 The catalytic mechanism of GTP hydrolysis by the small GTPase Ras serves as a prototype.3 GTPase activation proteins (GAPs) further accelerate the hydrolysis 105-fold.4 In the activated GTP-bound form, Ras interacts with multiple effector proteins; the most prominent one is Raf, which regulates proliferation via the mitogen-activated protein (MAP) kinase pathway. In oncogenic Ras, the switch-off by GTP hydrolysis is impaired. Ras oncogenes are found in about 25% of all human tumors. Therefore, a large number of different inhibitors have been developed to target oncogenic Ras itself or the components upstream or downstream of Ras.5
This article discusses how time-resolved FTIR spectra can be used as assays in screens for small molecules that possibly prevent movement to the “on” state of Ras and/or accelerate GTP hydrolysis. Both would down-regulate the Ras signaling pathway. The authors’ results show the importance of label-free screening with the native nucleotide, elucidating the normal behavior of GTPases in the presence of the potential interacting therapeutic molecules. Thus, time-resolved FTIR spectroscopy is an effective tool for studying interactions between small molecules and proteins with clear application for drug design and screening.
Experimental approach
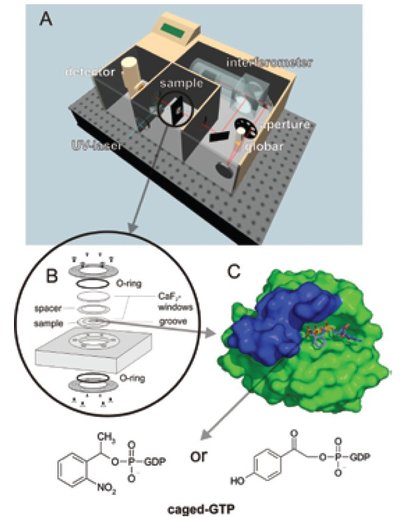
Figure 1 - Experimental approach.6 The setup of (a) the spectrometer with (b) the sample cuvette. The sample contains (c) Ras in buffer with bound caged GTP. For measurements at higher temperatures, the more stable 1-(2-nitrophenyl)ethyl (NPE)-caged GTP7 (left) should be used, while at lower temperature the faster para-hydroxyphenacyl (pHP)-caged GTP8 (right) is recommended. For the assays, small molecules or other proteins are added as detailed in the text. The switch-region of Ras is shown in blue. (Reproduced with permission from Ref. 6.)
Figure 1 shows the experimental setup for time-resolved FTIR spectroscopy.1 The spectrometer (Figure 1a) is equipped with a globar as the light source. The infrared light passes an aperture, an interferometer, and the sample, and finally reaches a liquid-nitrogen-cooled mercury cadmium telluride (MCT) detector. The sample can further be irradiated by an ultraviolet (UV) laser. The sample cell consists of two CaF2 windows separated by a spacer (Figure 1b). Due to the strong infrared absorbance of water, the pathlength is limited to 10 μm and a high concentration of the protein is necessary. In the case of GTPases, concentrations of ~200 μg/μL are used. In order to obtain difference spectra, the reaction has to be triggered within the spectrometer. In the difference spectra, only the absorptions of groups participating in the reaction are seen, but all other bands are canceled out. For GTPases, triggering is done by means of caged GTP, which is already placed within the binding pocket but does not hydrolyze, as shown in Figure 1c.7 By a laser flash GTP is formed and subsequent reactions can be followed.
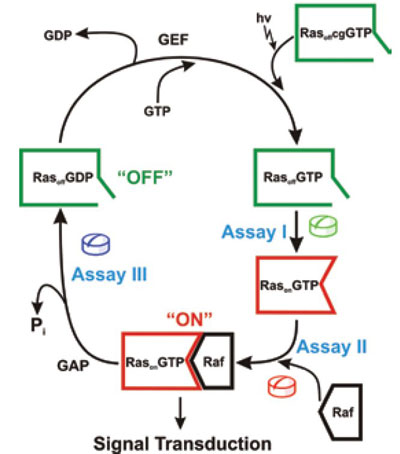
Figure 2 - Possible anticancer strategies involving down-regulation of Ras protein6; (assay I) Inhibition of active “on” conformation of the Ras protein by shifting the equilibrium toward “off” conformation, which has the least interaction with effectors; (assay II) interruption of the effector interaction with activated RasonGTP state with suitable small molecules (assay III) stimulation or acceleration of the Ras-bound GTP hydrolysis to GDP with GAP mimics. (Reproduced with permission from Ref. 6.)
The GTPase cycle
Figure 2 shows the GTPase cycle of Ras. In the experiments the authors entered this cycle by photolysis of Ras-caged GTP.8,9 In this process, RasoffGTP is formed. Afterward, the formation of RasonGTP can be observed by time-resolved FTIR.10 Molecules shifting the equilibrium toward the “off” state could prevent oncogenic Ras from signaling. Such molecules can be screened for in assay I, which detects changes in this equilibrium. Subsequently, RasonGTP can bind to an effector. This process is measured in assay II.6 The next process in the GTPase cycle is the termination of the signaling by GTP hydrolysis, which can also be monitored by time-resolved FTIR (assay III). The following elaborates two assays (I and III) as examples for screening by FTIR.
Switching of conformation states (assay I)
Ras wt shows after photolysis of the caged group the conformational change from RasoffGTP toward RasonGTP.10 The corresponding difference spectrum is shown in Figure 3a (red). On the other hand, the mutant Ras T35S (green) remains in the “off” state, showing no conformational change within this period. A screening can be done by measuring Ras wt together with a small molecule (black spectrum) and simple comparison of the resulting spectrum with the two spectra, the red spectrum standing for “no shift toward off state” and the green spectrum standing for “shift toward off state.” No assignment of any band to specific residues is necessary to prove an influence. However, several of the bands are already assigned by isotopic labeling of Ras or GTP.11,12 Thus, interactions can even be assigned to specific residues.
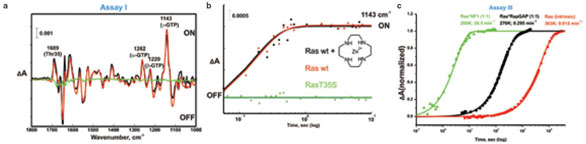
Figure 3 - Examples for the assays: a) Amplitude spectra representing the conformational changes after photolysis. Data for Ras T35S (green), Ras wild-type (red), and Ras wild-type in the presence of 20× zinc cyclen (black) are shown. While T35S remains in the “off” state (no conformational change), Ras wt shows the “off” to the “on” transition. The latter is not changed by zinc cyclen. b) Rate of this conformational transition monitored by the generation of the γ-phosphate vibration at 1143 cm–1 of the RasonGTP in the presence of the zinc cyclen (black, 6 s–1). Control Ras protein without zinc cyclen is shown in red (6 s–1). Again, no change is observed. The second control is Ras T35S mutant alone (green, kinetics without changes). Measurements were done in 4-(2-hydroxyethyl)piperazine-1-ethanesulfonic acid (HEPES), pH 7.5, 260 K. c) Kinetic analysis of the intrinsic hydrolysis activity at 303 K (red), and GAP-catalyzed hydrolysis activity (NF1, green, and RapGAP, black, at 260 and 270 K, respectively) of wild-type Ras. The plot shows the difference between the intensities of the α-phosphate vibration of GDP (1236 cm–1) and the α-phosphate vibration of GTP (1263 cm–1). In this case, the investigated molecule (RapGAP) is active.
Instead of using the fingerprint of the whole spectrum, the absorption of the asymmetric γ-GTP vibration at 1143 cm–1, which is the most intense marker band for the RasonGTP state,10 can be used for the assay (Figure 3b). While for Ras wt (red) an absorption increase is observed with a rate of about 6 s–1, the absorbance is not changed for Ras T35S (green).