oHeat of evaporation is the amount of heat required to make a physical change from the liquid phase to the gas phase, shown in the equation below.
Heat of evaporation of liquids has been done by several estimation techniques, most notable being the Clausius-Clapeyron equation:
Where R = gas constant, T = temperature (K), C = a constant, P = measured pressure, and Po = reference pressure.
ASTM standard E20711 uses this technique with a high-pressure differential scanning calorimeter (DSC). The technique is limited to liquids that boil within a narrow temperature range. Alexander et al.2 proposed a technique that uses thermogravimetric analysis (TGA) to generate evaporation data and uses zero-order Arrhenius kinetics and the Clausius-Clapeyron equation to determine the heat of evaporation. Houska et al.3 used a technique that measured the relative humidity (RH) above a hydrated sample at several temperatures and amounts of hydration. The %RH data were converted into partial pressure of water, and the Clausius-Clapeyron equation was used to determine the heat of evaporation. All of these tests are an estimation of the heat of evaporation because they all assume an ideal gas behavior, which is the basic assumption of the Clausius-Clapeyron equation.
Instead of an estimated measure of the heat of evaporation, the authors are proposing a direct measure of this heat. This can be performed using a simultaneous TGA-DSC instrument. The combined technique offers a direct measure of the heat of evaporation. This concept is shown in the following equation.
Watts (W) times seconds (s) can be substituted for the heat (J). Both the heat flow (W) and the mass (g) are converted into mW and mg, respectively. The seconds (s) from the numerator are then moved into the denominator. Now it can be seen that the heat of evaporation is just the heat flow (mW) divided by the rate of mass loss (mg/s). Both of these signals are produced by the TGA/DSC instrument. Also notice that this technique does not require a complete boiling transition. In fact, the sample does not need to completely evaporate, nor does it need to be a pure compound.
Experimental
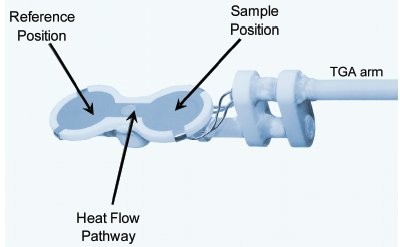
Figure 1 - TGA/DSC1 two-thermocouple DSC sensor. The heat flow pathway of the sensor is fixed and can be calibrated to give accurate DSC heat flow response. The surface is made of platinum for high thermal conductivity, and supported by a ceramic holder.
All experiments were conducted using the METTLER TOLEDO TGA/DSC1 (Columbus, OH) with nitrogen purge. The two-thermocouple DSC sensor, shown in Figure 1, was used. The experiments were all performed isothermally. The nitrogen flow rate was held at 1 mL/min (with the GC200 flow controller) while the sample was heating to the isothermal temperature; then the flow rate was increased to 100 mL/min to aid in the evaporation of the sample. The instrument was temperature calibrated with benzophenone and indium. The heat flow was calibrated with the evaporation of water at 25 °C. The crucible was a 40-μL aluminum (DSC style) crucible with a 120-mesh aluminum screen crimped on top. The aluminum screen allows the sample to evaporate, but retains the heat of evaporation. Without this screen, the heat is lost since the gas leaves the crucible and the heat of evaporation is too low. The reference crucible was an empty crucible with the aluminum screen crimped on top.
Evaluation of the resulting evaporation data was performed with the standard STARe software (METTLER TOLEDO) using the following steps.
- Open the data versus time in seconds.
- Correct the heat flow for zero heat flow reading in the region after the sample is completely gone.
- Calculate the derivative of the mass versus time.
- Divide the heat flow signal (mW) by the derivative (mg/s).
- The result is the heat of evaporation versus time.
- Report the average value.
Results and discussion
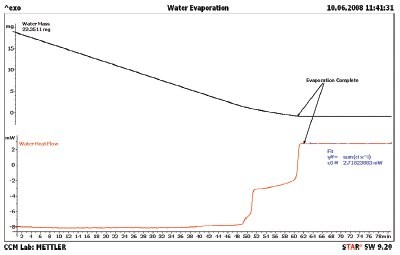
Figure 2 - Water evaporation showing the heat flow (red line) and mass loss (black line). The evaporation is complete at about 61 min. Note the change in heat flow in the 49–61 min range. This is due to a change in the exposed surface area of the water.
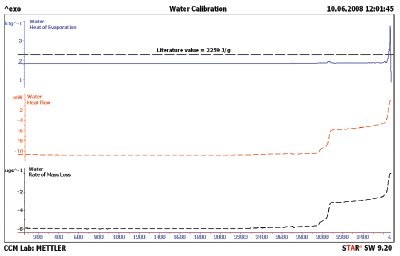
Figure 3 - Water evaporation showing the baseline-corrected heat flow (red line) and rate of mass loss (black line). The blue line is the result of dividing the heat flow data by the rate of mass loss data. The literature value is shown as the black dashed line in the top curve.
The first step to be taken with a new test method is calibration. Since mass and temperature calibration are specified in the users’ manual for the instrument, these will not be covered here. The heat of evaporation does need to be calibrated. Water was selected as the calibrant since it has a large heat of evaporation, 2259 J/g, and is easy to obtain in high purity. The results for a 25 °C isothermal TGA/DSC1 experiment are shown in Figure 2. The sample mass (black line) shows a continual loss, but not at a constant slope. The heat flow (red line) shows constant value up to 48 min when the heat flow changes three times before the evaporation is complete. The authors speculate that these steps are due to changes in the surface area of the water droplet. These steps can also be seen in the rate of mass loss (black line) shown in Figure 3. The heat flow signal was then divided by the rate of mass loss signal to obtain the heat of evaporation (blue line) in Figure 3. Even though the droplet changed the surface area, the resulting heat of evaporation is still constant through the 3000-sec region of Figure 3. All literature values for the heat of evaporation were taken from the publication in Ref. 4. The literature value for water is also shown (black dashed line). The DSC heat flow was calibrated, and the water sample was rerun; the results are compiled in Figure 4. The observed heat of evaporation of water was 2268 J/g, and the literature4 value was 2259 J/g; they agree to within 0.4% error.
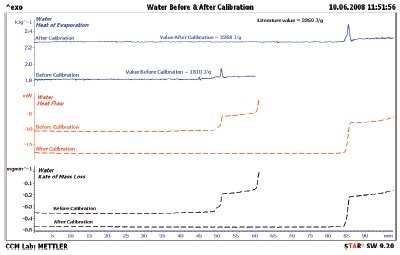
Figure 4 - Heat of water evaporation before and after calibration, along with the literature value. The calibrated value of the heat of evaporation of water is only off by 9 J/g; this is less than a 0.4% error.
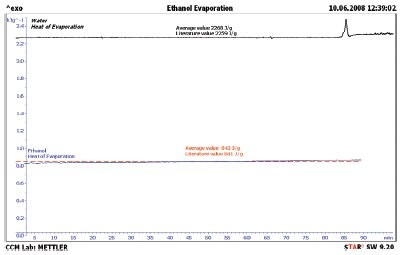
Figure 5 - Ethanol heat of evaporation (blue line), the literature value (red line), and the water heat of evaporation (black line) for comparison. The heat of evaporation of ethanol is only off by 2 J/g; this is less than a 0.3% error.
The test was then done using ethanol as the test sample. The results are shown in Figure 5. The heat of evaporation of ethanol was measured to be 843 J/g, and the literature value was 841 J/g4—an agreement of less than 0.3%. This is proof that the test works for pure liquids.
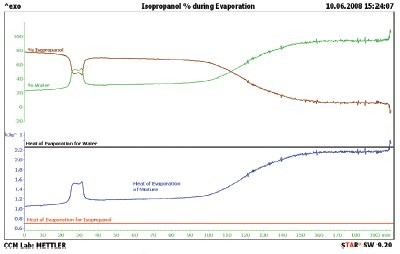
Figure 6 - Isopropanol (70%) evaporation (blue line), percent of isopropanol evaporating (brown line), and percent of water evaporating (green line). The heat of evaporation is measured continuously through the evaporation of the mixture, even though water and isopropanol evaporate at different rates.
Next, the authors tried expanding this test into mixtures of liquids. A mixture of 70 wt% isopropanol and 30 wt% water was tested; the results are shown in the blue line in Figure 6. The literature values for the heat of evaporation of isopropanol and water are shown in the red and black lines, respectively. The measured heat of evaporation stays within these two lines during the entire experiment. This is, of course, the expected result. If we assume that the heat of evaporation of a mixture is the linear sum of the components, we can produce the % isopropanol (brown line) and % water (green line) shown in the top of Figure 6. Again, as expected, we can see that the ratio of isopropanol and water changes during the experiment, favoring isopropanol at the beginning and water at the end. Isopropanol and water do form an azeotrope. The evaporation of isopropanol/water mixtures in these data is not the same as the expected azeotrope composition, 32.6% isopropanol, because in these experiments the liquid and gas are not in equilibrium.
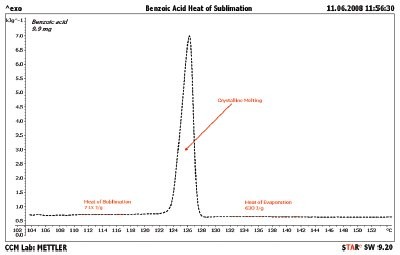
Figure 7 - Heat of evaporation of benzoic acid. The TGA/DSC1 was heated at 2 °C/min through the melting point of benzoic acid. The heat associated before the melting transition (713 J/g) is the heat of sublimation, since the sample is changing from a solid directly to a gas. The heat associated after the melting transition (630 J/g) is the heat of evaporation, since the sample is changing from a liquid to a gas.
Benzoic acid is another special case. Benzoic acid sublimes below the melting point and evaporates above the melting point. The results of analyzing benzoic acid are shown in Figure 7. Analysis of the region at 114 °C gives a result of 713 J/g for the heat of sublimation. The best literature value was extrapolated from the work of Ribeiro de Silva with an expected value of 742 J/g.5 The heat of evaporation, region near 136 °C, gives a result of 630 J/g. The authors could not find a reference value for this result.
Conclusion
The TGA/DSC1 can be used for determining the heats of vaporization and sublimation. Water is a suitable calibration material, and results were confirmed with ethanol. The technique does not require baseline separation between different decompositions, as demonstrated with the isopropanol/water mixture. The test is a direct measure of the heats. There are no “ideal gas” approximations required. Additionally, the heat of evaporation can be determined at a temperature other than the boiling point of the material, and the experiments were all performed at ambient pressure. This test should be widely accepted due to its simple direct measurement of heats of evaporation and sublimation.
References
- ASTM E2071, Standard Practice for Calculating Heat of Vaporization or Sublimation from Vapor Pressure Data, 2000.
- Alexander, K.S.; Dollimore, D.; Sorokina, T.V. Thermochim. Acta2002, 392–3, 315–21.
- Houska, M.; Landfield, A.; Nesvadba, P.; Kyhos, K.; Novotna, P.; Pruchova, J. J.Food Eng. 2008, 87, 59–63.
- Reid, R.C.; Prausnitz, J.M.; Sherwood, T.K., Eds. The Properties of Gases and Liquids, 3rd ed.; McGraw-Hill: New York, NY, 1977.
- Ribeiro de Silva, M.A.V.; Santos, L.; Schroder, B.; Fernandes, O. Thermochim. Acta 2004, 415(1–2), 15–20.
The authors are with Mettler-Toledo, Inc., 1900 Polaris Pkwy., Columbus, OH 43240, U.S.A.; tel.: 614-438-4686; fax: 614-985-8111; e-mail: [email protected].