Nanotechnology is pervasive, as evidenced by the abundance of information found in the latest scientific journals. What is nanotechnology? According to the National Nanotechnology Initiative,1 “a nanometer (nm) is one-billionth of a meter. A sheet of paper is about 100,000 of a nanometer thick. A gold atom is a third of a nm in diameter. Sizes between 1 and 100 nm are considered nano scale. Unusual physical, chemical, and biological properties can emerge in material at the nano scale. These properties may be different in important ways from the properties of bulk materials.” In fact, this technology is so important that the Japanese Instrument Analytical Manufacturers Association (JIAMA) presented a full-day seminar at Pittcon® 2009 on “State of the Art Technology from Japan with/for Nano-Technology,” which included multiple Japanese companies. This article describes a novel approach to measuring particle size at the nanoscale.
The nanoparticle measurement technology described in this article was under development for five years and has 36 patents pending. The IG-1000 single nanoparticle size analyzer (Shimadzu Scientific Instruments, Columbia, MD) is a compact benchtop instrument weighing about 15 kg. It measures particle sizes in the 0.5–200 nm range in 0.3 mL of sample volume.
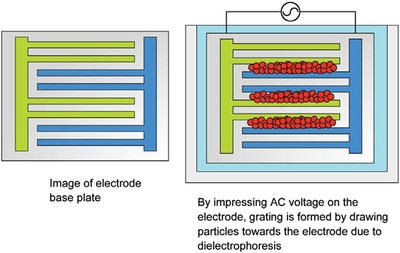
Figure 1 - Illustration of how an induced grating is created in the IG-1000.
Grating-based spectroscopy instruments, in which an optical grating separates wavelengths of light by diffraction, are common. Diffraction simply means changing the angle of light (in this case, from a laser) that is shined on or impinged on an object. In the IG-1000, an induced grating (IG) is created by impressing ac voltage on an electrode array, which is immersed in a solution of dispersed particles (the sample). The particles are then drawn toward the electrodes due to dielectrophoresis, forming this particle density grating, as shown in Figure 1. Some areas have a higher density of particles, while others have a lower density of particles. When the laser beam comes through this grating, it gets diffracted. The maximum intensity of primary diffracted light is then detected by the sensor. When the ac voltage is off, dielectrophoresis is off, and the particles start to diffuse away from the electrode array. The detected intensity of primary diffracted light begins to decay as time goes on and particles get farther and farther away from the electrodes. The decay of light intensity depends on the diffusion speed of the particles. Smaller particles will disperse more quickly than larger particles, as shown in Figure 2. The light intensity–time dependency behavior is then converted to the sample particle size and distribution information.
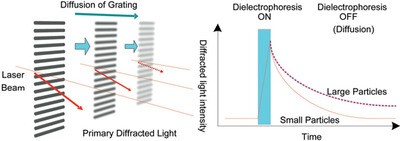
Figure 2 - Illustration of how changes in primary diffracted light intensity are converted to particle size information in the IG-1000.
One current technology for particle size measurement is dynamic light scattering (DLS). A major disadvantage of DLS is that because scattered light intensity is inversely proportional to the particle size, for particles less than 20 nm in size, the light signal becomes too weak to be detected. In addition, when the sample contains larger particles, particles with a wide size distribution, or particles mixed with agglomerates and contaminants, the signal from larger particles, agglomerates, and contaminants can significantly block the signal from smaller particles, which makes accurate measurement difficult to realize. For example, given the same volume, the relative signal intensity of 1-nm particles is about 1/1,000,000 that of 100-nm particles in DLS, according to the Mie scattering theory. In some sample systems, such as nanometer particles with a broad size distribution, nanometer particles with large agglomerates, or contaminants even in trace amounts, accurate measurement of the nanometer particles will be extremely difficult, if not impossible. On the other hand, the relative signal intensity of 1-nm and 100-nm particles is about the same when measured using the IG-1000, as seen in Figure 3. Thus, 1-nm particles having a broad distribution or some intrusion of agglomerates and contaminants can be measured accurately in the analyzer.
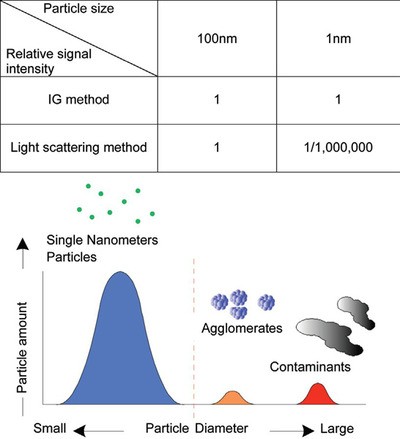
Figure 3 - Relationship between relative signal intensity and particle size in IG method and in light scattering method, a critical factor when agglomerates and contaminants are present with the single nanoparticles.
The IG method has a higher sensitivity for the measurement of particle sizes in the nano- and subnanoregion than current DLS technology, and the IG-1000 is much more resilient to the presence of contaminants than a DLS instrument. A normal laboratory environment is sufficient for the IG-1000, with no need for a cleanroom.
Figure 4 - Measurement of two types of ZnS nanocrystal quantum dots with the IG-1000.
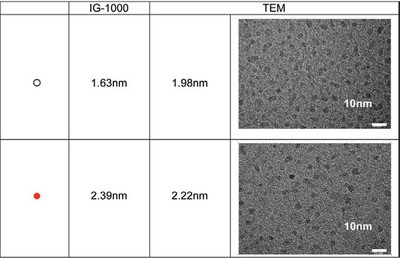
Figure 5 - Comparison of measurement results from IG-1000 and those from TEM for ZnS nanocrystals.
Figure 4 shows the IG-1000 measurement results for two samples of ZnS nanocrystal particles. One has a mean diameter of 1.63 nm, while the other has a mean diameter of 2.39 nm. ZnS nanoparticles are quantum dots. Their unique optical properties allow them to be able to assist in vitro or in vivo cellular imaging, offering high sensitivity and high resolution. Those optical properties depend on the particle size. Techniques such as transmission electron microscopy (TEM) can also be used to measure the diameter of nanoparticles, as shown in Figure 5. However, sample preparation for TEM is time consuming (requiring embedding, sectioning, staining, etching, and so on). The TEM instrument itself is bulky and expensive. The measurement is strictly performed in vacuum. Specially trained and experienced staff are needed for operation and maintenance of a TEM. On the other hand, for the IG-1000, sample preparation is minimal. The instrument itself is compact (600 × 400 × 200 mm) and much less expensive, easier to operate, and easier to maintain than a TEM. No special cleanroom is needed for operation since the IG-1000 measurement is resilient to the presence of contaminants. The accuracy of the results from the analyzer is demonstrated in Figure 5, with results closely matching those from TEM.
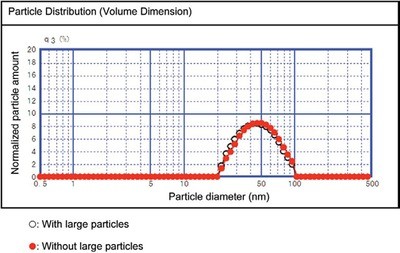
Figure 6 - Measurement results of polystyrene latex: 46-nm particles with and without 1-µm large particles as contaminants.
High resistance to the presence of contaminants in the IG-1000 is further demonstrated in Figure 6, in which the measurement results of latex particles with a mean diameter of 46 nm are barely affected by the presence of large particles with a mean diameter of 1 µm. This type of measurement can be difficult to realize in light-scattering-based methods, as mentioned earlier.
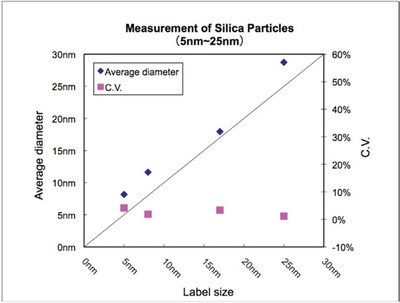
Figure 7 - Measurement results of silica nanoparticles from 5 to 25 nm.
Silica nanoparticles from 5 to 25 nm can be measured in the IG-1000 with high accuracy and repeatability, as demonstrated in Figure 7. Data nonuniformity can be 5% or less, even for particles as small as 5 nm. In comparison, small silica particles pose a challenge for DLS for two reasons: 1) the signal intensity for 5-nm particles is very low, as explained above, and 2) the refractive index of silica is close to that of water; thus distinguishing scattered light intensity from background can be a problem since the signal-to-noise ratio is low.
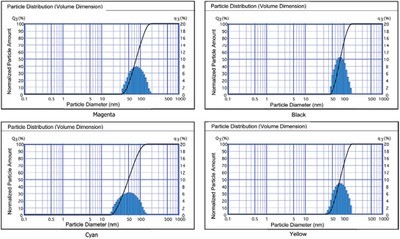
Figure 8 - Measurement of particle size in pigment inks of different colors for QA.
In addition to single nanoparticles, bigger particles or particles having a wide distribution up to 200 nm can also be measured with the IG-1000, demonstrating the flexibility of the system. From pioneering nanotechnology and biomedical research to industrial QA laboratories, the analyzer can provide the same high-quality data at much reduced costs in time and money versus TEM and other particle size measurement techniques. In Figure 8, particles in pigment inks of different colors were characterized by the IG-1000. For quality control, accurate measurement of particle size is essential since particle size affects the viscosity, texture, and thus the performance of the pigment ink. Furthermore, dark inks normally have a low transmittance, which may not be high enough for the source laser to pass through and generate a measurable scattered light signal.
The advantages of this technology can be summarized as 1) high sensitivity for single-digit nanoparticle sizes; 2) accurate measurement of a broad distribution of particle sizes, even at the nanoscale; 3) significantly decreased influence of agglomerates (clusters) or contaminants; and 4) particle size results can be validated using the diffracted light intensity–time dependency data.
Given the increasing interests and demands in nanotechnology, development of new particle size analyzers other than traditional light-scattering-based methods is critical. The IG-1000 has made a significant step forward.
Reference
- The National Nanotechnology Initiative—Strategic Plan, Dec 2007. Prepared by Subcommittee of Nanoscale Science, Engineering, and Technology; Committee on Technology; National Science and Technology Council.
Dr. Yang is Physical Testing Product Specialist, Dr. Clifford is Industrial Business Unit Manager, and Mr. Vial is Physical Testing Product Manager, Shimadzu Scientific Instruments, 7102 Riverwood Dr., Columbia, MD 21046, U.S.A.; tel.: 800-477-1227; fax: 410-381-1222; e-mail: [email protected]. Dr. Shimaoka is Particle Size Product Manager, Shimadzu Corp., Kyoto, Japan.