Fast, direct, quantitative elemental analyses of solids that are difficult to digest are hallmarks of the DC Arc technique. The earliest DC Arc instruments relied on photographic plate detectors. These instruments provided a permanent photographic record of a sample's spectrum, but the plates were cumbersome and time-consuming to develop and interpret. These detectors were replaced by photomultiplier tubes (PMTs), which significantly improved sample throughput; however, measurements could not be made with simultaneous background correction, nor could a complete record of the spectrum be collected.
The solid-state array detector rivals the speed of the PMT-based DC Arc systems, with the added benefit of providing a permanent record of the full DC Arc spectrum. The spectrometer used in this work provides full wavelength coverage and offers advantages such as simultaneous background correction, the use of multiple wavelengths per element, the ability to perform time-resolved analysis, and reduced analysis time per sample.
Samples that are suitable for analysis by DC Arc include ceramics and glass, metal oxides, carbides, borides, nitrides, refractory powders such as tungsten oxide and zirconium oxide, geological materials, precious metals, paints, graphite powder, and nuclear materials such as uranium oxide and plutonium oxide. Virtually any material can be analyzed for trace elements by DC Arc.
DC Arc permits these samples to be analyzed in their native form without digestion prior to analysis. Digestion procedures are often complex and time-consuming, and increase the risk of sample contamination during preparation. More importantly, these digestion procedures often dilute the analytes of interest to levels below the detection limit obtainable with the technique being used to measure them.
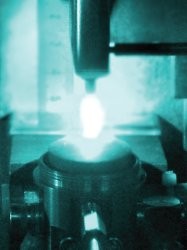
Figure 1 - Real-time view of the DC Arc sample
and counterelectrodes during the analysis of high-purity copper.
The determination of trace elements in high-purity copper is rapid and simple when performed by DC Arc because samples can be analyzed in their native metallic form (see Figure 1). Direct analysis eliminates the need for sample digestion and dilution, which greatly increases sample throughput and results in better detection limits than those obtained with other analytical techniques. These benefits are demonstrated in the work described here as it applies to the analysis of trace elements in high-purity copper.
Experimental
A Prodigy DC Arc spectrometer (Teledyne Leeman Labs, Hudson, NH) was used to generate the data in this work. The DC Arc stand contains a current-stabilized power supply, which enhances the stability of the arc. A Stallwood jet is available to reduce CN band emission. The Stallwood jet can be used with a variety of mass-flow controlled gases, each of which is controlled with the same dedicated microprocessor that controls current through the arc stand. Multiple gases can be used over the course of a single burn and each gas flow can be independently controlled to increase the rate of sample burn, or to optimize arc conditions throughout a burn.
The sample and counterelectrodes were purchased from Bay Carbon Inc. (Bay City, MI) and were used as received. The sample electrodes were 1/4 in. in diameter with a crater and a 1-in. post (part #PD-1). The counterelectrodes were 1/8 in. in diameter and pointed (part #C-1 ST-21). A 4-mm analytical gap was used, and the position of the electrodes was adjusted during the sample burn to maintain a distance of 4 mm between the sample and the counterelectrode.
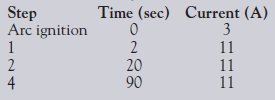
The DC Arc stand was operated in forward polarity mode using the current-controlled program listed in Table 1. All analyses were performed in air and without the use of a Stallwood jet. Nitrogen was used to purge the optical path between the DC Arc and the spectrometer's optical entrance window. This gas was used for the first 20 sec of the DC Arc burn, at a flow rate of 1 L/min in order to analyze for sulfur at 180.7 nm. After 20 sec, the nitrogen flow rate was reduced to 0 L/min, and the remaining 70 sec of the burn was performed without a gas for the purged optical path.
Table 1 - DC Arc stand powerconditions for forward polarity mode
The instrument was calibrated with several high-purity copper standards that contained the analytes of interest at concentrations that ranged from 0.01 to 100.0 ppm. The copper standards consisted of certified reference materials produced from unalloyed copper rods and were used as received. Standards were obtained from NIST (Gaithersburg, MD) (NIST 494, 495, 496, and 497), CANMET (Delta, BC, Canada) (SSC-1, SSC-2, and SSC-3), Xstrata (Zug, Switzerland) (KIDD IRM QC), and Copper-Spec (Salt Lake City, UT) (CS001, CS005, CS010, CS030, CS050, CS100, CS200, and CS500). Copper was used as an internal standard for all sample analyses.
Results and discussion
For the analysis of high-purity copper samples, the DC Arc allows the emission from the analytes of interest to be separated in time. Once the arc is formed, the analytical cycle progresses, and elemental impurities in the sample are volatilized at varying rates. Once volatilized, each impurity is excited in the arc and emits its characteristic wavelength of light, generating a unique distillation profile that can be measured by the optical spectrometer. An example of this phenomenon is shown in Figure 2 for copper. These distillation profiles can be used for choosing integration time periods that maximize the signal-to-noise ratio for each analyte of interest.
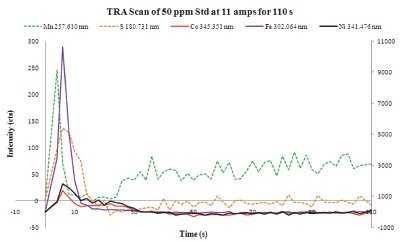
Figure 2 - Time-resolved analysis scan of Co, Fe, Mn, Ni, and S in the 50.0-ppm calibration standard.Data for Mn and S are plotted on the primary axis using dashed lines. Data for Co, Fe, and Ni are plotted on the secondary axis using solid lines.
For this work, elements were grouped into one of two integration periods based on the results obtained from time-resolved analysis (TRA) scans of a 50.0-ppm calibration standard. Elements that were observed to volatilize off relatively quickly (see Figure 2) were collected in the first timing group, and emission from those elements was collected for the first 20 sec of the DC Arc burn. Elements that were collected in the second timing group were more refractory in nature and emitted light for a relatively long period of time as they slowly boiled off (data not shown). Data for these elements were collected for the last 70 sec of the DC Arc burn. The copper evolved throughout the DC Arc burn and allowed for the use of a copper internal standard for both timing groups.
Table 2 - Wavelengths, background correction points, and integration times used
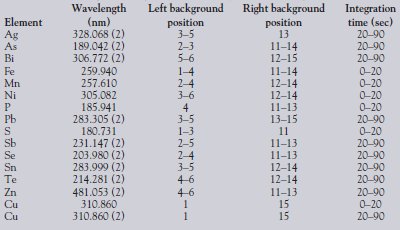
Based on the data collected from TRA scans, all wavelengths of interest were grouped into 1 of 2 integration periods. Integration times and wavelengths chosen for all data collection are outlined in Table 2. The Prodigy's detector typically uses a 3 × 15 pixel subarray to collect data for each analyte. The analytical peaks and background correction points are defined in each subarray with pixel position and width values. The pixel positions used for background correction at each wavelength of interest are listed in Table 2. For elements in which background correction included more than one pixel on the same side, multiple values are listed to indicate the positions for all the pixels used. Elements included in the second timing group (integration commenced 20 sec after igniting the DC Arc and continued for 90 sec) are denoted with a "2" following the wavelength listing in Table 2. For each analyte of interest, background correction was performed simultaneously with the peak measurement.
As mentioned above, the optical path was purged with nitrogen for 20 sec, which coincided with the data collection for the first timing group, specifically sulfur. The use of a moderate flow (1 L/min) of nitrogen effectively removed air from the optical path, which allowed emission from sulfur to be collected. However, the use of a purge gas reduced the stability of the DC Arc and caused it to wander around the sample more than it would have without the use of a purge gas. For this reason, the nitrogen flow was reduced to 0 L/ min after data collection for sulfur was complete, and data for the second timing group were collected without a purged optical path.
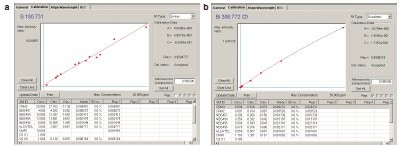
Figure 3 - a) Calibration curve of S at 180.731 nm in high-purity copper. b) Calibration curve of Bi at 306.772 nm in high-purity copper.
Examples of typical calibration curves for elements measured in high-purity copper are illustrated in Figure 3a and b. The figure contains calibration curves for sulfur at 180.731 nm and bismuth at 306.772 nm to demonstrate typical precision and linearity for elements measured in the first and second timing groups, respectively.
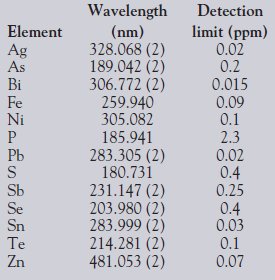
A study was performed to determine the instrument's detection limits for the elements of interest. Detection limits were calculated based on three times the standard deviation of seven replicate measurements of a 0.1-ppm calibration standard. Results for the detection limit study are listed in Table 3 and are listed in units of parts per million (ppm).
Table 3 - Detection limits in highpurity copper
Conclusion
The analysis of high-purity copper was performed successfully using the Prodigy DC Arc spectrometer. The use of a nitrogen-purged optical path allowed for the determination of sulfur in high-purity copper with sub-ppm detection limits, which has never before been published. The purged optical path also permitted the first reported determination of phosphorus in high-purity copper at a wavelength free from spectral interferences from copper itself.
The use of two integration periods enabled emission from volatile elements to be collected separately from emission from more refractory elements, which improved the overall sensitivity and detection limits for the method. The results presented in this work indicate that, with the exception of phosphorus, the instrument's detection limits for all measured analytes were below 1 ppm.
As reflected in the detection limit data, the current-controlled DC Arc power supply, combined with the simultaneous data collection of both peak and background data, provide exceptionally reproducible sample burns, which is indicated in the detection limits obtained for trace elements in high-purity copper.
Dr. Mahar, Mr. Kunselman, and Dr. Brown are with Teledyne Leeman Labs, 6 Wentworth Dr., Hudson, NH 03051, U.S.A.; tel.: 603-886- 8400; fax: 603-886-9141; e-mail: [email protected]. Mr. Dalager is with Analytical Reference Materials International, Golden, CO, U.S.A. Mr. Perzl is with Spectral Systems, Fürstenfeldbruck, Germany.