Spectroscopy is increasingly being used in biopharmaceutical formulation development to characterize
protein structure and the response of structure to the
formulation configuration. The application of spectroscopy
to formulation development is generally
based on the premise that stable protein conformations
provide high real-time physical stability.1 The
challenges in applying spectroscopic studies to protein
characterization are the interpretation and
quantitation of the results.2–5 Data interpretation is
difficult because protein spectra are a convolution of
multiple overlapping components, the assignments
of which are based on comparisons to model compounds
and theoretical calculations. The lack of resolution
of spectral features requires the use of deconvolution
methods to enhance the details of the
spectrum. While these can be successful at augmenting
spectral features, deconvolution alone does not
solve the problem of quantitation. Without adequate
quantitation, the application of spectroscopy to the
assessment of formulations/configurations is not
effective. This paper explores the use of difference
spectra6 for characterizing and quantifying changes
in protein structure as applied to formulation development.
The method of calculating difference spectra
is explained and the application of infrared- and UV-difference spectra to formulation development is
illustrated in three examples.
Unlike most analytical methods, which are separative
and thus allow for quantitation of modified protein,
spectra are a convolution of all of the components of
a sample. Therefore, an assessment of purity generally
cannot be made by inspection of a single spectrum.
Rather, changes in the sample spectrum are determined
relative to a spectrum of a reference state.
Thus, the choice of an appropriate reference state is
crucial to utilizing spectroscopy to guide formulation
development, as has been shown for FTIR spectra.7,8
Some examples of reference states and their applicability
include: the initial time-point for samples on
stability, the liquid state for determining lyophilization-induced changes, the previous formulation when
a formulation change is made, the recommended storage
condition versus a stressed condition, and wild-type
protein compared to site-directed mutants.
Once the reference state for a given experiment has
been chosen, the next important step is deciding
how to analyze the spectra in order to determine the
nature and extent of changes between the sample
and the reference. Some methods of data analysis
that have been explored include: visual comparison,
computation of the 2nd and 4th derivatives,4,9 and
Gaussian curve-fitting.5 Visual inspection is highly
subjective, may not readily differentiate subtle
changes, and does not allow quantitation.
Calculation of the 2nd (and higher) derivative
removes subjectivity and can allow for quantitation,9
but suffers from amplification of sharp peaks (including
noise) and suppression of broad, flat regions of
spectra.3 Gaussian curve-fitting becomes complicated
when broad, multicomponent spectra can be
fit to multiple solutions.3
Another well-known approach to the evaluation
and quantitation of changes in spectra
(especially for FTIR) that has not been pursued
for formulation development is difference spectroscopy.6 In difference spectroscopy, the difference
between the sample and reference state
spectrum highlights only changes, which simplifies
data interpretation. This aspect is particularly
useful in late-stage formulation development,
a time when usually only subtle changes
to the formulation/configuration are made and
thus any differences are expected to be relatively
small. The difference spectra require no
empirical input parameters to be calculated and
are not expected to amplify sharp peaks or
noise. Furthermore, normalization of the spectra
allows for a quantitative assessment of the
changes. Like the other methods, difference
spectra also suffer from some drawbacks. The
main caveat of difference spectra is that they
report only on the net change between the sample
and the reference. Structural rearrangements
that do not result in an alteration in the
sample spectrum will go undetected; e.g., loss of
α-helix in one portion of a protein may be
masked by the formation of a similar amount of
α-helix in another segment of the molecule.
The method also does not overcome the difficulty
of assigning relative importance to
changes observed in various spectral bands.
Rather, the magnitude of the changes in the
sample spectrum relative to the reference spectrum
is used to drive data evaluation and interpretation.
Nonetheless, it is the ability of the difference
spectra to highlight small changes without distortion
of peak heights, widths, or noise levels that makes
the method advantageous.
The application of difference spectroscopy to formulation
development is illustrated here. Three case
studies demonstrate the ability of difference spectroscopy
to quantitate changes in the spectra of proteins:
difference infrared spectra correlated with
solid-state changes, difference infrared spectra illustrating
the effect of different lyophilization cycles on
protein structure, and difference UV spectra to detect
and quantitate changes between mutant and wild-type
samples of a protein. In all cases, the approach
was to induce small variations in protein structure—by varying temperature, lyophilization cycle parameters,
and constructing a point mutation—and assess
the changes by difference spectroscopy.
Methods
FTIR spectra were recorded on an MB104 series Fourier-transform infrared spectrometer (ABB
Bomem, Norwalk, CT) equipped with a deuteride
triglyceride sulfate (DTGS) detector. The instrument
was purged continuously with dry nitrogen to
minimize water vapor. Spectra of powder samples
were collected on a DuraSamplIR II attenuated total
reflection (ATR) accessory (Smiths Detection,
Danbury, CT) fitted with a diamond triple-bounce
internal reflection element. A total of 32 scans were
collected for each spectrum at a resolution of 4 cm–1.
Single-beam spectra of both the background (R0)
and sample (R) were recorded, and the ATR
absorbance was calculated as ATR = –log(R/R0) in
GRAMS/32 AI, version 6.01 software (Thermo
Electron Corp., Philadelphia, PA). Spectra were
interactively corrected for water vapor and then
baseline- and offset-corrected between 1715 and
1590 cm–1 (amide I).
UV spectroscopy was performed using a model 14NT-UV-VIS spectrophotometer (Aviv Instruments,
Piscataway, NJ). Absorbance spectra between 250
and 305 nm were recorded in steps of 0.1 nm with a
1-nm bandwidth. Protein was diluted to 1.0 mg/mL
in a 1.0-cm-pathlength quartz cuvette. The reference
cell contained formulation buffer.
All spectra were area-normalized to 1.0 over the chosen
wavelength range to correct for concentration differences.
The reference state spectrum was chosen and subtracted
from the sample spectra. For these sample-minus-reference
spectra, negative peaks indicate loss of features
from the reference state, while positive peaks indicate
growth of features in the sample. The extent of change in
the difference spectra was quantified by integrating the
absolute value of the difference spectra within the specified
wavelength range (the area of difference, or AoD).6
Because the spectra are normalized to 1.0, the AoD represents
the net percent difference in the sample spectrum.
Results
Case 1: Structural changes in
the lyophilized state
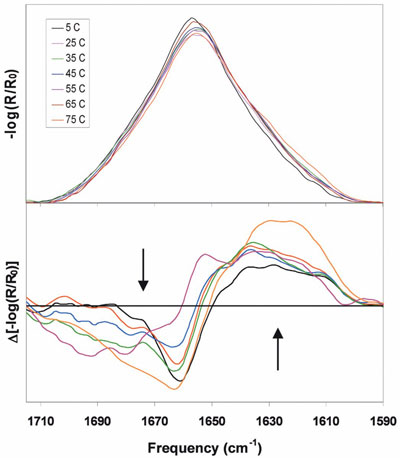
Figure 1 - Top: Amide I region FTIR spectra for a protein stored at
the indicated temperatures for 7 weeks. Bottom: Sample-minus-5 °C control
difference spectra of the same samples. Arrows indicate direction of
change with increasing temperature.
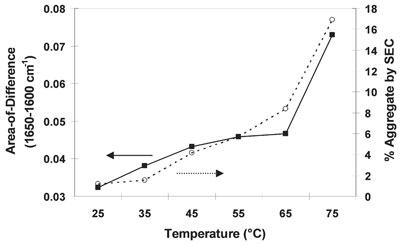
Figure
2 - Correlation between the AoD of the spectra in Figure 1 with the amount of aggregate
measured by SEC.
This experiment was done as part of an accelerated
temperature study in order to characterize the thermally
induced structural changes in a lyophilized formulation
over time. One goal was to relate protein
structural changes determined by FTIR to analytical
data (size exclusion chromatography [SEC]) post-reconstitution. Figure 1 (top) shows the FTIR spectra
of a protein in the amide I region after 7 weeks at several
temperatures, including the 5 °C control. Visually,
changes can be seen as the growth of amplitude on the
low-frequency side of amide I (~1630 cm–1) with loss
of amplitude on the high-frequency side (~1670 cm–1).
The difference spectra (Figure 1, bottom) show only the
changes relative to the 5 °C control, simplifying the data
evaluation. The trend in the changes
with temperature is more apparent. The
features on the high-frequency side of
amide I may be assigned to loss of random
turns and high-frequency vibrations
of α-helices, while the low-frequency
bands gained in the samples,
centered near ~1630 cm–1, may arise
from vibrations of intermolecular contacts
or aggregated strands.10 The area of
the positive bands (~1650–1600 cm–1)
is a measure of the features gained in the
sample spectra, i.e., the extent of
change in secondary structure of the
protein with temperature. These bands
may be assigned as intermolecular contacts
or aggregated strands, and thus the spectral area from
1650 to 1600 cm–1 may be a measure of the growth of
aggregates in the solid state.
Figure 2 shows an overlay of the AoD (1650–1600
cm–1) with the SEC data (% aggregate formed) versus
temperature. There is a good correlation between the
data (r = 0.98). Together, these results suggest that
irreversible aggregation is occurring in the solid state,
and that, for this formulation, the FTIR data correlate
well with the amount of postreconstitution aggregation
by measuring the area of the difference spectrum.
Case 2: Use of FTIR difference
spectra to compare two
different lyophilization cycles
One sometimes-difficult aspect of formulation and
fill-finish development is the need to select and set
conditions for lyophilization in advance of long-term
stability data. Subtle differences in the final drug
product (FDP) as a function of lyophilization cycle
parameters may not be resolved by analytical release
data. As demonstrated above and several times in
the literature, FTIR spectra can assess structural
changes to the protein in the solid state.7,8 The spectra
do not predict chemical stability, but at least offer
a way to determine the extent of change from the
solution state of the protein, which is usually taken
as the most stable conformational state and the
appropriate state from which to compare lyophilization-induced changes.
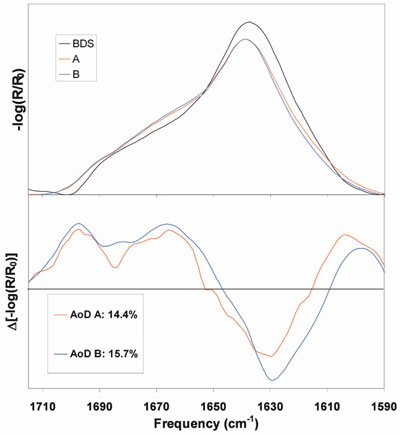
Figure 3 - Top: Amide I region FTIR spectra for a protein as a BDS and after
lyophilization by cycles A and B. Bottom: Sample-minus-BDS control difference spectra
of the same samples. A has an AoD of 14.4%, while B has an AoD of 15.7% over
the amide I region.
Figure 3 shows FTIR spectra of a bulk drug substance
(BDS) and a protein after lyophilization by methods
A and B. There is loss of the main band at 1635 cm–1
and slight gains in the shoulders at 1670 and 1690
cm–1. By choosing the BDS as the reference state and
calculating the difference spectra, the changes
become more evident and can be quantified. The
difference spectra show a loss of features at 1630
cm–1 (β-sheet) and gains at 1665 cm–1 (turns) and
1695 cm–1 (aggregated strands).10
The nature of the changes in both lyophilization
cycles is comparable, and does not help distinguish
the two. However, the area of the difference spectrum
for lyo cycle A is 1.3 percentage points more
similar to the BDS than B. Thus, A retains more
solution-like structure, which is taken to be the most
stable conformational state and hence possesses the
best real-time physical stability.1,7,8 The AoD
allowed for discrimination between subtle differences
in the lyophilization cycles, which are not evident
in the spectra themselves. Although the magnitude
of the difference between cycles A and B is small, it serves as a useful guide for selecting between
the two in the absence of differentiating release or
stability analytical data.
Case 3: UV difference
spectra for understanding
protein structural changes in
site-directed mutants
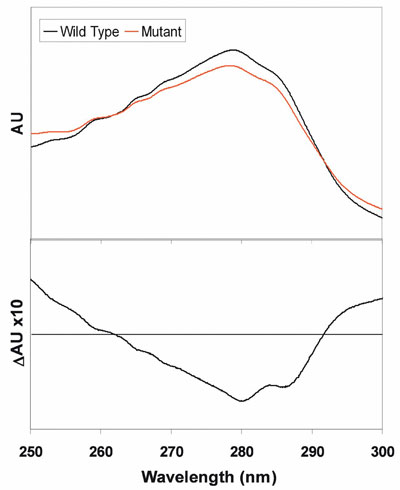
Figure 4 - Top: UV absorbance spectra of the wild-type and site-directed mutant forms of a protein.
Bottom: Mutant-minus-WT difference spectrum.
In this experiment, UV spectra were collected as part
of a study to assess changes to the tertiary structure
of a protein in a site-directed mutant compared to
the wild type (WT). UV spectra of the WT and
mutant proteins are shown in Figure 4. Changes in
the UV absorbance are evident. The mutant-minus-WT difference spectrum highlights the changes only,
which are due to a band with peaks at 280 and 287
nm. Such an absorbance profile matches well with
the absorbance of Tyr residues.11 In this case, the
point mutation changed the known hydrogen-bonding
partner to a Tyr in the WT protein. Because of
this, a change in the Tyr UV spectrum is expected.
The difference spectrum verifies the expectation
that a Tyr will be affected by the mutation, and the
AoD over the 250–300 nm range indicates a 10%
loss in spectral integrated intensity.
Conclusion
In this paper, the authors have shown that difference
spectroscopy can be useful in formulation development
for highlighting and quantitating small changes
observed in spectra. The method can be applied to the
analysis of any set of spectra for which an appropriate
reference state spectrum can be obtained. Difference
spectra require no empirical input parameters to be
computed, do not amplify noise or sharp peaks, and can
be quantitated for comparison with other spectra or
analytical data. Difference spectra are a useful complement
to other methods for analyzing spectroscopic data.
References
-
Roberts, C.J. Kinetics of irreversible protein aggregation:
analysis of extended Lumry-Eyring models and
implications for predicting protein shelf life. J. Phys.
Chem. B 2003, 107, 1194–207.
- Dong, A.; Prestrelski, S.J.; Allison, S.D.; Carpenter,
J.F. Infrared spectroscopic studies of lyophilizationand
temperature-induced protein aggregation. J.
Pharm. Sci. 1995, 84, 415–24.
- Jackson, M.; Mantsch, H. The use and misuse of FTIR
spectroscopy in the determination of protein structure.
Crit. Rev. Biochem. Mol. Biol. 1995, 30, 95–120.
- Lange, R.; Balny, C. UV-visible derivative spectroscopy
under high pressure. Biochim. Biophys. Acta
2002, 1595, 80–93.
- Surewicz, W.; Mantsch, H. New insight into protein
secondary structure from resolution-enhanced infrared
spectra. Biochem. Biophys. Acta 1988, 952, 115–30.
- Barth, A.; Zscherp, C. What vibrations tell us about
proteins. Q. Rev. Biophys. 2002, 35, 369–430.
- Prestrelski, S.J.; Arakawa, T.; Carpenter, J.F.
Separation of freezing- and drying-induced denaturation
of lyophilized proteins using stress-specific stabilization.
II. Structural studies using infrared spectroscopy.
Arch. Biochem. Biophys. 1993, 303, 465–73.
- Prestrelski, S.J.; Tedeschi, N.; Arakawa, T.; Carpenter,
J.F. Dehydration-induced conformational transitions
in proteins and their inhibition by stabilizers. Biophys.
J. 1993, 65, 661–71.
- Kendrick, B.S.; Dong, A.; Allison, S.D.; Manning,
M.C.; Carpenter, J.F. Quantitation of the area of overlap
between second-derivative amide I infrared spectra
to determine the structural similarity of a protein
in different states. J. Pharm. Sci. 1996, 85, 155–8.
- Goormaghtigh, E.; Cabiaux, V.; Ruysschaert, J.M.
Determination of soluble and membrane protein
structure by Fourier transform infrared spectroscopy.
III. Secondary structures. Subcell. Biochem. 1994, 23,
405–50.
- Lange, R.; Frank, J.; Saldana, J.L.; Balny, C. Fourth
derivative UV-spectroscopy of proteins under high
pressure I. Factors affecting the fourth derivative spectrum
of the aromatic amino acids. Eur. Biophys. J.
1996, 24, 277–83.
Dr. Vrettos is a Scientist, Mr. Affleck and Mrs. Guo are Research
Associates III, Dr. Spitznagel is Executive Director, and Dr.
Krishnamurthy is Associate Director, Dept. of Pharmaceutical
Sciences, Human Genome Sciences, Inc., 14200 Shady Grove
Rd., Rockville, MD 20850, U.S.A.; tel.: 240-314-4400, ext.
1376; fax: 301-354-4178; e-mail: [email protected].