Differential scanning calorimetry (DSC) is used to determine
thermodynamic properties including specific heat,
glass transition, and melting points of a variety of materials.
The need for accurate determination of thermal properties at
high temperatures (>700 °C) has spurred the development
of high-temperature differential scanning calorimetry (HTDSC). The introduction of HTDSC increased the
upper temperature limit of DSC’s capability to 1400 °C,
allowing thermal analysis of high-temperature materials
such as ceramics and silicates.1 However, the accuracy and
reproducibility of HTDSC measurements has not been rigorously
studied, especially at high temperatures. In particular,
there is a need to determine the impact of experimental variables
on the quality of results of HTDSC measurements.
Studying the effects of these variables will help generate recommendations
for the experimental parameters needed to
produce the most reliable results.
Background
The analysis of DSC traces to determine the heat capacity of
samples typically employs either the ratio method2 or the
ASTM method. In the ratio method, three consecutive
measurements are made using the same experimental conditions
and temperature history. The first measurement is a
baseline run made with empty crucibles. For the second
measurement, a standard material is kept in the sample crucible;
the third measurement is made with an actual sample
in the sample crucible. The heat capacity of the sample can
be calculated from the following:
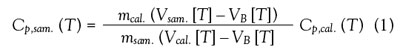
where Cp,sam. and Cp,cal. are the heat capacities per mass of
the sample and reference standard at temperature T; msam.
and mcal. are the masses of the sample and reference material;
VB is the difference between the thermocouple voltages in
the sample and reference chambers at T; and Vsam. and Vcal.
are functions of the sample or reference material, the pan,
and a calibration factor. The calibration factor in turn is a
function of temperature and sample geometry.3
The ASTM method (ASTM E 1269) also requires three
measurements with an identical temperature program,
including isothermal segments at the beginning and the end. Three measurements—baseline, standard, and sample
runs—are made and the measured signals are corrected for
baseline shifts. In addition, the differences in isothermal segments
from zero are corrected by a linear correction curve
that is derived from the signal in the isothermal runs. Thus,
corrected standard and sample signals are obtained that are
used in Eq. (1) to calculate the heat capacity of the sample.4
Also, for accurate specific heat measurements, the baseline
run is repeated twice to ensure stability and reproducibility.
Experimental
A model 409C simultaneous thermal analyzer with Pt-Rh furnace (Netzsch Instruments, Burlington, MA) was used for all
measurements. An HTDSC sample carrier with platinum crucibles
and lids was used. As described above, heat capacity measurements
were done using the ratio method, after completing
the required three runs for a given experimental condition.
Samples were heated from room temperature to 1400 °C. A set
of experimental parameters (sample size, standard material and
size, heating rate, choice and flow rate of cover gas) was selected
for each series of experiments. After the baseline run and standard
run, four DSC traces were made using identical conditions.
Different experimental conditions used to determine the effect
of these variables on the measurements are as follows:
- Platinum sample: Circular-shaped samples were cut from
99.99% platinum foils. The diameter of these samples
(~5.5 mm) was slightly less than the inside diameter of
the platinum HTDSC crucibles. Thicknesses 0.127,
0.254, and 0.625 mm of respective masses 94.6, 180.0,
and 341.0 mg were used.
- Cover gas: High-purity Ar (99.998%) was used as the cover
gas. Flow rates used included 27.4 and 51.7 cm3 min–1.
- Standard material: Sapphire of thickness 0.25 and 0.50
mm. Platinum of 0.254-mm thickness was also used.
- Heating rate: 20 K min–1 was used for most of the measurements.
Though a heating rate of 40 K min–1 was used for
some experiments, long-term use of this heating rate is
not recommended by the manufacturer due to its adverse
impact on the life of the furnace.
Results and discussion
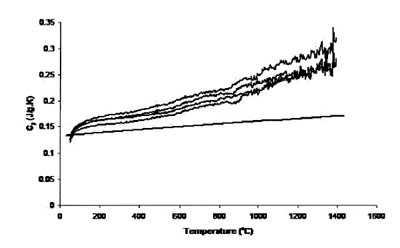
Figure 1 - Measured heat capacity of platinum (180-mg sample,
0.25-mm sapphire standard, 20 K min–1 heating rate, 27.4 cm3 min–1 Ar
flow). Straight line is literature value.
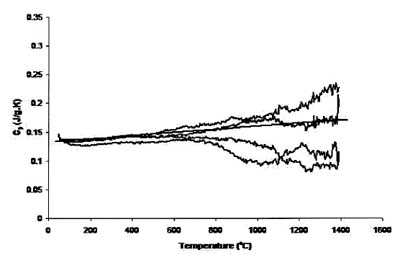
Figure 2 - Measured heat capacity of platinum (94.6-mg sample,
0.25-mm sapphire standard, 20 K min–1 heating rate, 27.4 cm3 min–1 Ar
flow). Straight line is literature value.
Figure 1 shows the result of four traces using the 0.25-mm-thick
platinum foil as the sample, a 0.25-mm sapphire standard, a heating rate of 20 K min–1, and 27.4 cm3 min–1 Ar
flow rate. The single straight solid line in the figure is the
“literature” heat capacity of platinum. It is apparent that the
experimental data are substantially different from the literature
data. This may be due to the difference between the
masses of the sample and the standard. It also shows that the
uncertainty level grows with temperature, especially above
800 °C. Figure 2 shows the results of four traces using the
0.127-mm platinum foil, keeping all other experimental
parameters constant. The accuracy has improved over that
of Figure 1, but increased uncertainty levels at temperatures
above 800 °C are also apparent.
When heat capacities were measured using the same
experimental conditions and sample as Figure 1, with the
exception of an increased heating rate (40 K min–1), the
reproducibility of the results was better than that seen in
Figure 1. However, the stress that this heating rate imposes
on the instrument recommends against long-term use of
this practice.
Another set of runs was made with an even thinner platinum
sample (94.6 mg), 0.25-mm platinum standard, 20 K
min–1 heating rate, and 27.4 cm3 min–1 Ar flow. This was followed
by a set of runs with a 40 K min–1 heating rate. Using a
0.127-mm piece of platinum foil as the standard instead of a
0.25-mm sapphire standard reduced the accuracy of the
average measured heat capacity; using a higher heating rate
improved the reproducibility, especially above 1000 °C.
From the average of measured heat capacities of the above-mentioned
sets of runs, it was observed that using platinum
samples of 0.127- and 0.25-mm thickness at 20 K min–1 and
40 K min–1 heating rate, respectively, with a 0.25-mm sapphire
standard gave heat capacity values close to literature
data. From the standard deviation of measurements, maximum
deviation was observed with a platinum sample of
0.127 mm at 20 K min–1 heating rate, 27.4 cm3 min–1 Ar flow
rate, and 0.25-mm platinum standard. This could be associated
with the minimal thickness of the sample and buckling
of foil inside the crucible.
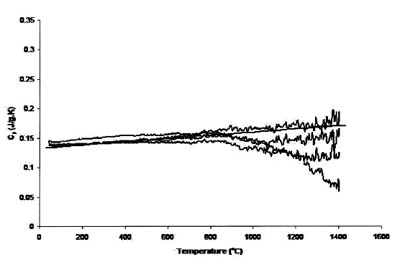
Figure 3 - Measured heat capacity of platinum (180-mg sample,
0.50-mm sapphire standard, 20 K min–1 heating rate, 27.4 cm3 min–1 Ar
flow). Straight line is literature value.
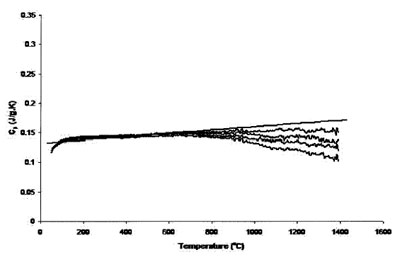
Figure 4 - Measured heat capacity of platinum (180-mg sample,
0.25-mm sapphire standard, 40 K min–1 heating rate, 51.7 cm3 min–1 Ar
flow). Straight line is literature value.
Figures 3 and 4 compare the effect of cover gas flow rate on
the accuracy and uncertainty of the results. Figure 3 shows
the results of measurements using a 0.25-mm sample, 20 K
min–1 heating rate, 27.4 cm3 min–1 Ar flow rate, and 0.5-mm sapphire standard. Compared with the results in Figure 1,
which used 0.25-mm-thick sapphire as the standard, the
measured heat capacity is much closer to that expected, but
it is apparent that the uncertainty above 800 °C is still substantial.
Figure 4 shows measurements with the same piece
of platinum, 40 K min–1 heating rate, 51.71 cm3 min–1 Ar
flow rate, and 0.25-mm sapphire standard. The accuracy of
both sets of runs was roughly equivalent, but the reproducibility
of the results is better for those measurements
using a higher heating rate.
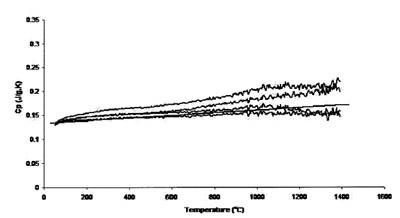
Figure 5 - Measured heat capacity of platinum (0.625-mm sample,
0.50-mm sapphire standard, 20 K min–1 heating rate, 27.4 cm3 min–1 Ar
flow). Straight line is literature value.
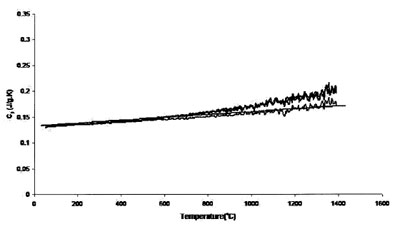
Figure 6 - Measured heat capacity of platinum (0.625-mm sample,
0.625-mm platinum standard, 20 K min–1 heating rate, 27.4 cm3 min–1
Ar flow). Straight line is literature value.
Figures 5 and 6 show the results achieved for a 0.625-mm-thick
platinum sample with 0.5-mm sapphire disk and 0.625-mm platinum disk as standards, respectively. These two sets
of runs compare the effect of calibration standard on accuracy
and uncertainty. Accuracy and uncertainty were better for
both sets of conditions, although a 0.625-mm-thick platinum
standard showed maximum reproducibility and accuracy. The
best results are from those measurements performed using the
0.625-mm platinum sample. The thicker (and heavier) sample
provides better surface contact with the sample crucible,
improving heat transfer and thus instrument accuracy. In
addition, a standard of size and mass comparable to that of
the sample tends to generate more accurate results.
Conclusion
Experimental conditions were varied to study their effect on
the accuracy and reproducibility of heat capacity measurements
made with a high-temperature differential scanning
calorimeter. Use of a higher heating rate, calibration standard
of similar size and mass as the sample, and a larger sample
mass can give much more accurate and reproducible heat
capacity measurements.
References
- Loeb, D.W.; Brammer, A.J.; Charsley, E.L.; Warrington, S.B.
Am. Lab.1987, 1, 87–90.
- Shaw, T.L.; Carol, J.C. Int. J. Thermophys.1998, 19(6),
1671–80.
- Hongtu, F.; Laye, P.G. Thermochim. Acta1991, 180, 81–7.
- ASTM Standards, Doc. No. ASTM E 1269, Mar 1, 2005.
Ms. Jacob is a Graduate Research Assistant, and Dr. Schlesinger is Professor
of Materials Science & Engineering, Dept. of Materials Science
and Engineering, University of Missouri—Rolla, 1870 Miner Cir.,
Rolla, MO 65409-0340, U.S.A.; tel.: 573-341-6773; fax: 573-341-
6934; e-mail: [email protected]. This material is based on work supported
by the National Science Foundation under Grant No. DMR–0404605.
The authors are also grateful to Ms. Darlene Ramsay (UMR) and Mr.
John Kelly and Dr. Jack Henderson (Netzsch Instruments, Burlington,
MA, U.S.A.) for their assistance.