The field of polymer composites is a rapidly developing area of study in materials science. The addition of a variety of new component materials, such as carbon fibers, clay, carbon nanotubes, nanocrystalline cellulose, etc., to polymeric matrices is designed to enhance properties and add value to the end-use product. Invariably, however, the added composite components can affect the processing conditions required to produce a functional material. In addition, it is important to understand the degradation and/or failure mechanism of polymer composite materials.
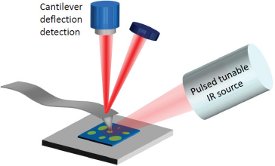 Figure 1 – In this implementation of the AFM-IR technique, a pulsed, tunable IR laser source illuminates a sample film from the top side. When a molecular vibration is excited by a particular wavenumber of the laser, the absorbed radiation induces a rapid thermal expansion in the sample that excites resonant oscillations in the AFM cantilever. The instantaneous position of the cantilever is determined by reflecting a visible laser off the top of the cantilever.
Measurement tools capable of chemically characterizing the interphase region between a particular nanomaterial inclusion and the bulk polymer are needed to help enhance understanding of composite polymers. The use of such powerful nanoscale chemical characterization tools may contribute to the understanding of failure mechanisms and accelerate the development of these new polymer composites, helping formulators converge more efficiently on optimal processing conditions. The recent combination of atomic force microscopy and infrared spectroscopy (AFM-IR) has led to the ability to obtain IR spectra with nanoscale spatial resolution, nearly two orders-of-magnitude better than conventional Fourier transform infrared (FTIR) microspectroscopy.1–7
Fiber polymer composites
Carbon fiber composite materials are found in a variety of commercial products, including planes, automobiles, boats, and sporting goods. They are used to reduce overall weight while maintaining or exceeding the mechanical strength of metallic counterparts. Understanding the carbon fiber/matrix interface is a key area of research. Surface treatments and sizing, which is a thin coating of no more than a few hundred nanometers around the carbon fiber, dictate the mechanical properties of the overall composite.8 Therefore, understanding the chemical composition at the interface between the carbon fibers and the surrounding epoxy matrix with submicron spatial resolution is critical for understanding and enhancing the properties of fiber composites.
 Figure 2 – The nanoIR2 AFM-IR instrument, including a tunable IR laser source, IR-beam delivery optoelectronics, and AFM measurement module.
Fiber composite materials are challenging samples for surface chemical analysis because the spatial resolution of many techniques is coarser than the scale of the interface. FTIR spectroscopy has been a dominant technique in providing such chemical information, but its spatial resolution is diffraction limited to 3–10 μm. In this study, the spatial resolution has been improved to ~100 nm using AFM-IR spectroscopy. The previous configuration of the AFM-IR experiment used total internal reflection illumination from below the sample and required thin samples (less than 1 μm) to be deposited onto IR transparent optics.1–7 In this work, top-side illumination was used, which allowed measurements with substantially simplified sample preparation. In this configuration, it was possible to obtain spatially resolved chemical characterization of a carbon-epoxy composite.
Experimental
The nanoIR2™ AFM-IR instrument (Anasys Instruments Corp., Santa Barbara, CA) used to collect the spatially resolved IR spectra is a new reconfiguration of an earlier version that has been described in detail elsewhere.4–7 An operational schematic and photograph of the AFM-IR instrument with top-side illumination are shown in Figures 1 and 2, respectively. A sample of a carbon fiber/epoxy composite was prepared for analysis and mounted on the sample stage of the AFM-IR instrument; using an AFM image as a guide, locations of the carbon fiber and the surrounding epoxy matrix can be spectroscopically examined. The use of top-side illumination made it possible to measure the polished face of the carbon fiber/epoxy sample, without the need to prepare a thin section by microtomy, as often required by prior AFM-IR instruments.
All AFM-IR data were obtained in contact mode with an Access-C cantilever (AppNano, Mountain View, CA). The tunable IR laser produced laser pulses of 10 nsec at a repetition rate of 1 kHz, with a spectral resolution of better than 8 cm–1 over the whole tuning range. The IR power levels incident on the sample was about 0.5 mW, and the focused laser spot size was about 50 μm. The AFM-IR spectra were collected from 1100 to 1800 cm–1, with a data point spacing of 4 cm–1. A total of 128 cantilever ringdowns4 were co-averaged for each data point. Mechanical property images were collected on the same instrument platform using a different AFM cantilever in Lorentz contact resonance (LCR) mode.9
Results
Figure 3 shows an AFM topography image along with a series of AFM-IR spectra collected along a line with 100-nm spacing. The spectra recorded in the region of the carbon fiber (red) are very broad and featureless. The IR absorption from the epoxy matrix is stronger and clearly changes as a function of distance from the interface with the carbon fiber. Figure 4 shows an overlay of two selected AFM-IR spectra extracted from Figure 3 recorded at the locations indicated in the epoxy region of the AFM image. The differences in the IR spectra suggest the chemical nature of the epoxy is different close to the carbon fiber than it is farther away.
 Figure 3 – AFM-IR spectra (a) and AFM topography image (b) collected on a cross-section of a carbon fiber/epoxy composite film. The spectra recorded from the correspondingly colored locations on the AFM image are sequentially spaced at 300 nm and are offset for clarity.
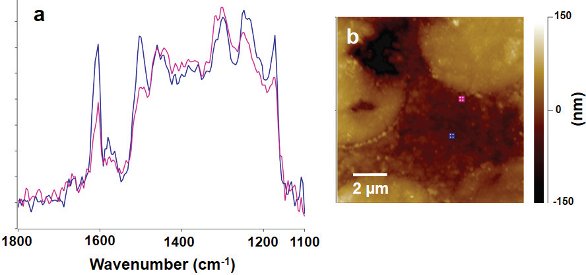 Figure 4 – Overlay of two selected AFM-IR spectra (a) extracted from Figure 3 recorded at the locations indicated in the epoxy region of the AFM image (b). The differences in the IR spectra suggest the chemical nature of the epoxy is different close to the carbon fiber than it is farther away.
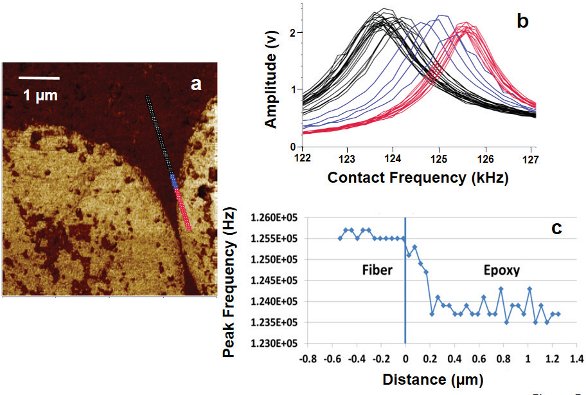 Figure 5 – Lorentz contact resonance image (a) of two carbon fibers in the epoxy matrix showing contrast based on mechanic stiffness. Locations where the mechanical response spectra (b) were collected along a line with 50-nm spacing are shown on the image. The black contact resonance mechanical spectra were recorded in the epoxy region, the red spectra in the carbon fiber region, and the blue spectra in the interphase region. The corresponding contact resonance peak frequency is plotted as a function of distance from the boundary between the carbon fiber and epoxy matrix (c).
Figure 5 shows a mechanical stiffness LCR9 image of two carbon fibers in the epoxy matrix. The contrast in the image is based on mechanic stiffness differences, with the carbon fiber having a higher peak contact resonance frequency corresponding to higher stiffness. Locations where individual mechanical response spectra were collected along a line with 50-nm spacing are shown on the image. The black contact resonance mechanical spectra were recorded in the epoxy region, the red spectra in the carbon fiber region, and the blue spectra in the interphase region. The contact resonance peak frequency plotted as a function of distance from the boundary between the carbon fiber and epoxy matrix clearly shows there is a gradient of mechanical stiffness in the interphase region of the epoxy. This result is consistent with the AFM-IR spectral results shown in Figures 3 and 4, where the IR spectra in the interphase region are also clearly different.
Conclusion
The use of a new spectroscopic AFM detection technique in which a tunable IR laser source illuminates the sample from the top side allows the chemical environment of a carbon fiber/epoxy composite to be probed below the diffraction limit of traditional infrared microspectroscopy. The AFM-IR spectrum of the epoxy matrix is clearly different within a hundred nanometers of the interface with a carbon fiber than it is in the bulk. The ability of measurements such as these to provide chemical insights into this key interfacial region is important for producing better carbon fiber composites. Additional such investigations probing the interphase region between bulk polymers and nanomaterial inclusions at submicrometer-length scales should help enable advances in the emerging field of polymer nanocomposites.
References
- Dazzi, A.; Prazeres, R. et al. Local infrared microspectroscopy with subwavelength spatial resolution with an atomic force microscope tip used as a photothermal sensor. Opt. Lett. 2005, 30, 2388–90.
- Dazzi, A.; Prazeres, R. et al. Analysis of nanochemical mapping performed by an AFMbased (‘‘AFMIR’’) acousto-optic technique. Ultramicroscopy 2007, 107, 1194–1200.
- Dazzi, A.; Prazeres, R. et al. Chemical mapping of the distribution of viruses into infected bacteria with a photothermal method. Ultramicroscopy 2008, 108, 635–41.
- Marcott, C.; Lo, M. et al. Spatial differentiation of sub-micrometer domains in a poly(hydroxyalkanoate) copolymer using instrumentation that combines atomic force microscopy (AFM) and infrared (IR) spectroscopy. Appl. Spectrosc. 2011, 65, 1145–50.
- Dazzi, A.; Prater, C.B. et al. AFM-IR: combining atomic force microscopy and infrared spectroscopy for nanoscale chemical characterization. Appl. Spectrosc. 2012, 66, 1365–84.
- Ye, J.; Midorikawa, H. et al. Nanoscale infrared spectroscopy and imaging of a polycarbonate/acrylonitrile-styrene/ butadiene blend. Microscopy and Analysis 2012, 26, 24–7.
- Marcott, C.; Lo, M. et al. Applications of AFM-IR—diverse analyses at nanoscale spatial resolution. Microsc. Today 2012, 20, 16–21.
- Manocha, L.M; Ysuda, E. et al. Effect of carbon fiber surface treatment on mechanical properties of C/C composites. Carbon 1988, 26, 333–7.
- Lee, B.; Prater, C.B. et al. Lorentz force actuation of a heated atomic force microscope cantilever. Nanotechnology 2012, 23, 055709.
Curtis Marcott, Ph.D., is a Senior Partner, Light Light Solutions, P.O. Box 81486, Athens, GA 30608, U.S.A.; tel.: 513-720-0171; e-mail: marcott@ lightlightsolutions.com ; www.lightlightsolutions.com. Michael Lo, Qichi Hu, Eoghan Dillon, Kevin Kjoller, and Craig Prater are with Anasys Instruments, Santa Barbara, CA, U.S.A.; www.anasysinstruments.com. This research was supported in part by NSF-SBIR grants 0750512 and 0944400.