The advent of a new technology often brings far-reaching benefits well beyond the initial perception of its key advantages. Acoustic dispensing, for example, with the ability to have highly controlled droplet transfers at 2.5-nL increments with exquisite precision and accuracy, does much more than save money by eliminating pipets. It enables new work flows, including those in which multiple pharmaceutical firms have seen dramatic differences in the true success or failure of compounds. This article shows how the use of acoustic dispensing and direct dilution leads to the creation of better compound structures and the potential for faster development of new drugs.
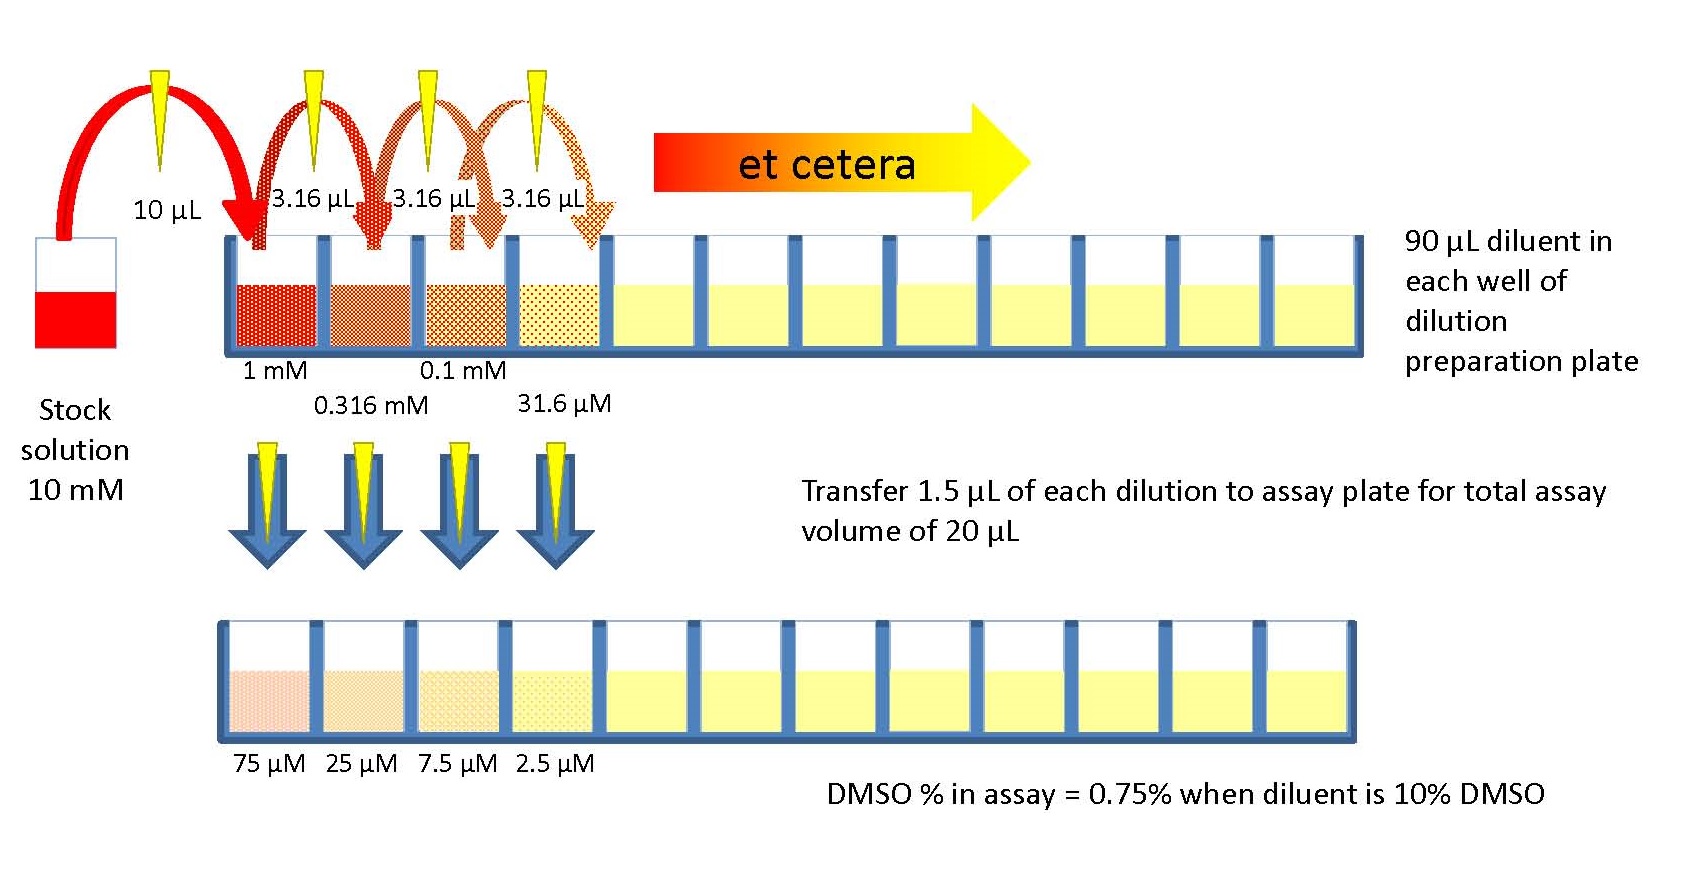
The serial dilution technique1 using pipets is a well-established way to obtain a series of increasingly dilute solutions to understand the effect of dosing. In this technique, a volume of concentrated stock solution is diluted with a liquid. To generate more dilute concentrations, an aliquot of the diluted solution is further diluted with buffer (Figure 1). Doing a tenfold dilution six times in a row generates a solution that one hopes to have one-millionth the concentration of the initial stock solution.
Direct dilution using an acoustic liquid handler
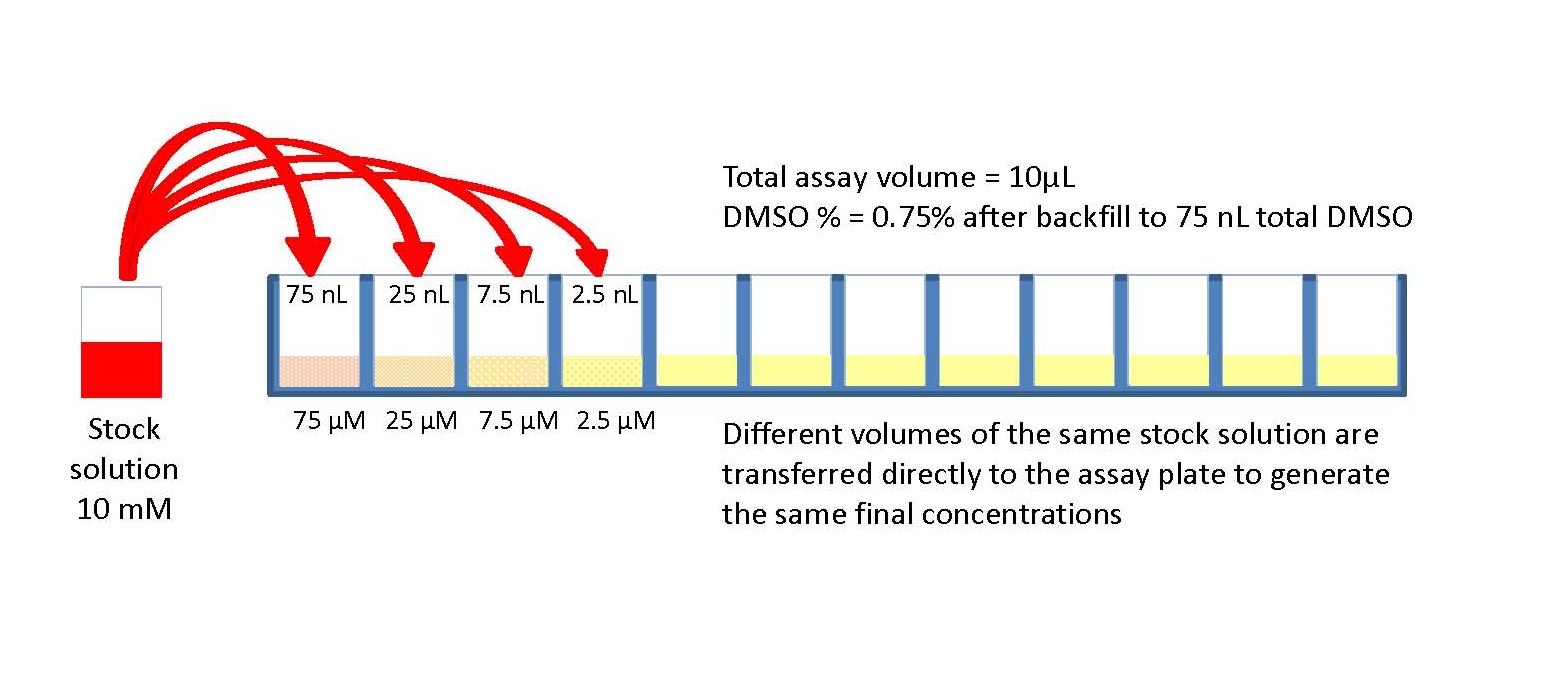
Figure 2 – Direct dilution provides a number of advantages over serial dilution. When the Labcyte Echo liquid handler is used, the solutions are never in contact with a pipet tip, pin tool, or spray nozzle. This eliminates the potential for both leachates and cross-contamination. Stock solution is transferred directly to the assay wells to generate the same concentrations obtained in serial dilutions. Because the amount of stock solution is so small, the sample can be maintained in pure DMSO to reduce the chance of sample precipitation during dilution. Compounding error is eliminated since samples are not serially diluted. In general, significantly less sample is used to generate the final concentration ranges. Direct dilution also generates less liquid and solid waste, reducing downstream expenses. Note that after backfill, the concentration of DMSO in the assays is 0.75%. Note also that only 110 nL of sample is used to develop the first four points of the gradient. The last eight points require 255 nL additional sample. The direct dilution method uses far less sample than the serial dilution method. This figure shows only the first four concentrations via direct dilution. More complete examples covering 12 half-log steps are covered in the literature.6,9
Direct dilution follows a simpler process.5–9 Controlled volumes of the same concentrated stock solution are transferred directly to individual assay wells to achieve the desired end concentration. Essential to direct dilution is the ability to accurately transfer extremely small volumes of stock solution, which is generally not possible with pipets. The Labcyte® Echo® acoustic liquid handler (Labcyte Inc., Sunnyvale, CA) is frequently used in the pharmaceutical industry to generate concentration ranges via direct dilution (see Figure 2).
In a recent paper,10 Ekins et al. analyzed data generated by researchers11,12 at the pharmaceutical giant, AstraZeneca (AZ, Wilmington, DE). Those researchers ran experiments that generated results that deviated unexpectedly from what one would anticipate. They ran dose–response experiments to generate IC50 values in order to determine the potency of a series of newly synthesized compounds (substituted diaminopyrimidines) as an anti-cancer therapeutic against a receptor (EphB4) that appears to have multiple roles in cancer promotion and suppression. The IC50 value of a chemical is that concentration that reduces the biological effect of the enzyme by 50%. The lower the IC50 value, the more potent the compound, i.e., it requires lower concentrations to achieve 50% inhibition. The goal is to find compounds that work at the lowest doses, because those compounds are more likely to lead to safe and efficacious drugs.
Direct dilution vs serial dilution method
The AZ researchers generated their range of compound concentrations using two different techniques. In the first instance, they performed serial dilutions with 5% DMSO as the diluent. They also generated a concentration gradient with a direct dilution using the Labcyte Echo system.
Table 1 – IC50 values for 14 diaminopyrimidines*
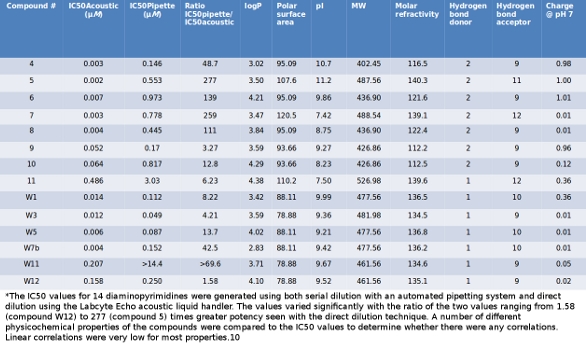
The data generated by the AZ researchers are summarized in Table 1. For each of the 14 compounds tested, the IC50 value generated by the direct dilution/acoustic method showed greater effect at lower doses than the value generated by the serial dilution/pipet method. The difference was far from trivial, with compounds 5 and 7 being more than 250 times more “active” with the acoustic method. The data also show that there was no systemic error that pushed all values in a consistent manner. There was no correlation between the IC50 values or the rank order of the two data sets.
It is important to note that without direct dilution achieved through acoustic liquid handling, the AZ researchers would have obtained indicators that the diaminopyrimidines were poor inhibitors of EphB4. It seems unlikely that they would have chosen to further investigate the potential of these compounds if they had relied on the serial dilution/pipet method.
We compared IC50 values derived via each dilution process to a number of properties of the compounds in an effort to determine what might cause the differences between them. We found no correlation between the IC50 values when compared to hydrophobicity (logP), polar surface area (PSA), isoelectric point (pI), molecular weight (MW), molar refractivity (A), hydrogen bond donors (HBD), hydrogen bond acceptors (HBA), or charge. While these results are quite disturbing, it is not possible at this point to determine which process yields the correct IC50 data. All that can be said is that there is a substantial apparent difference between the techniques based on the measured values.
We generated pharmacophores based on the structures of the compounds and their IC50 values. A pharmacophore is a computer model that suggests the types, kinds, and spatial proximities of binding features in the target (EphB4 receptor). One pharmacophore was generated from the data from each dispensing and dilution technique.
Table 2 – Comparison of pharmacophores*
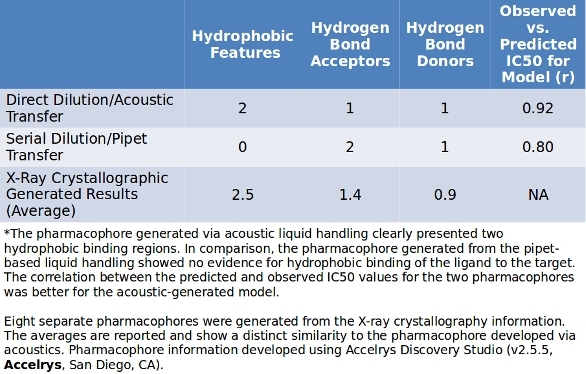
As expected from such different IC50 data, the two pharmacophores are very different (Table 2). The fit of the tested molecules to the developed pharmacophore was much better with the acoustic data (r = 0.92) than with the pipet-based technique (r = 0.80). Most notably, the pharmacophore generated by direct dilution with acoustics shows the presence of two hydrophobic binding regions, while the serial dilution by pipet tips method suggests a complete absence of these regions.
Normally, a medicinal chemist with the help of a computational modeler would use the generated pharmacophores to generate new compounds that might bind more tightly and more specifically to the active site of the target molecule. In this case, the chemist would be faced with a significant problem which path should be followed? Should the next generation of compounds include hydrophobic regions or not? How many hydrogen bond donors and acceptors should be designed into the structure and where should they be located relative to each other? Until further experiments are done, it is not possible to determine which pharmacophore more closely models the actual target.
Fortunately, we were able to find additional publications that tested the same EphB4 receptor with similar diaminopyrimidines.13 This gave us the opportunity to test the predictive capabilities of the two pharmacophore models we had generated.
We found that the pharmacophore generated via serial dilutions using a pipet system was completely nonpredictive. The predicted order of potency was compared to the measured value of potency and a negligible correlation value of 0.184 was obtained.
On the other hand, the acoustic pharmacophore suggested that the compounds tested in the new set would be very potent inhibitors. The IC50 values generated by the AZ researchers placed these compounds as extremely active. Importantly, the acoustic pharmacophore correctly predicted the ranking of their potency.
These results strongly suggest that the data generated by the acoustic technique were superior to those generated by the automated pipet. Significantly, additional data show that the acoustic pharmacophore closely resembled the actual binding site of the native target.
Generation of pharmacophores from X-ray data
X-ray crystallography data are often considered to be the gold standard when describing the actual physical shape of a protein. Published X-ray data of the EphB4 receptor14–17 allowed us to generate pharmacophores directly from the physical structure. A series of eight pharmacophores were generated from the X-ray data. All eight were very similar in structure and showed binding features positioned in space with close similarity. All of them showed the presence of hydrophobic binding regions. As mentioned previously, the acoustic data also suggested the importance of these regions while the pipet-based technique discounted them. The average results of the eight pharmacophores are included in Table 2.
It is clear that, in this case, the direct dilution technique using acoustic liquid handling generated better data and a pharmacophore that correctly predicted the activity of new compounds. Additionally, the pharmacophore generated by the technique was very similar to the pharmacophores from the X-ray data. The serial dilution with pipets technique failed markedly on both fronts.
Was this particular case using the EphB4 receptor an anomaly? Was there something special about these compounds that caused the deviation from the expected? It appears that the answer is no. Other work presented by AstraZeneca and Bristol-Myers Squibb (BMS, New York, NY) suggests that this type of result is common. AZ presented a poster18 that measured the inhibition of 11,000 compounds. There was a marked difference between the two techniques with the acoustic technique suggesting significantly more active compounds. They reported that the acoustic method generated a much lower rate of false positives and false negatives than pipet-based techniques. BMS showed results19 on over 1000 compounds that also suggested that compounds tended to be more active when transferred via the acoustic method. Why would that be the case?
We believe that the intimate contact between the dilute solutions generated by serial dilutions, the containers in which they are mixed, the pipet tips with which they are moved, and the inaccuracy of dispensing all contribute to the deleterious effect of pipetting. As volumes are miniaturized from 96-well format to 1536-well format, the surface-to-volume ratio increases by a factor of 4 and allows more potential for material to be adsorbed from solution. This makes the actual concentration of compound in solution much less than anticipated.
In addition, the adsorption is not limited to hydrophobic binding. The results of these experiments as well as those performed by various pharmaceutical companies show a negligible correlation to logP. While a dependence on logP has been shown in certain specific cases, we believe that there are other driving forces. In any case, the elimination of serial dilution should benefit the discovery process.
Conclusion
We began this work because we realized that the databases used by many researchers, both public and private, would have limited utility if the data contained in them were dependent on liquid handling techniques. Since there are no metadata included in the databases to differentiate between compounds transferred acoustically versus those transferred via pipets, the results would be an amalgamation of all and would yield meaningless results. This would lead researchers down unfruitful paths as they design the next set of compounds. We urge researchers, at a minimum, to include the method used to make their dilutions as well as the method used to transfer solutions in their data.
Further, we strongly encourage researchers, especially in the pharmaceutical industry, to determine specifically what factors of the compounds lead to such differences in results and, in the meantime, use direct dilution with acoustic dispensing to avoid the now-exposed problems inherent to the more traditional method. Without this understanding, researchers are likely to spend time and resources developing new compounds based on assay artifacts rather than on real biological mechanisms. This understanding should allow us to create better drugs more quickly, generate biological tools with greater specificity, and reduce wasted effort significantly. As a postscript, we are aware that not all scientists perform high-throughput screening. We believe this paper to be relevant to small-scale experiments using serial dilution and manual pipetting. They, too, may be at risk of erroneous data generation.
References
- http://en.wikipedia.org/wiki/Serial_dilution.
- McDonald, G.R.; Hudson, A.L. et al. Bioactive contaminants leach from disposable laboratory plasticware. Science 2008, 322, 917; doi: 10.1126/science.1162395.
- Belaiche C.; Holt, A. et al. Nonylphenol ethoxylate plastic additives inhibit mitochondrial respiratory chain complex I. Clin. Chem. 2009, 55, 1883–4; doi: 10.1373/clinchem.2009.130054.
- Cesarek, J.; Nie, D. New Tool for Automating Serial Dilutions for Activity Confirmation Experiments. Poster, Lab Automation Exhibition and Conference, San Jose, CA, 2005.
- Olechno, J.; O’Connell, J. et al. Improving IC50 Analyses by Reducing Compound Waste, Compound Precipitation, Accumulated Error and Consumables Cost. Poster, LabAutomation, Palm Springs, CA, 2006.
- Olechno, J.; Shieh, J. et al. Improving IC50 results with acoustic droplet ejection. J. Assoc. Lab Automat. 2006, 11, 240–6.
- Comley, J. Serial vs direct dilution: time to apply new thinking to IC50 determination and dose-response analysis? Drug Discov. World 2007 Spring, 36–50.
- Turmel, M.; Itkin, Z. et al. An innovative way to create assay ready plates for concentration response testing using acoustic technology. J. Lab. Automat. 2010, 15, 297–305; doi: 1016/j.jala.2009.04.002.
- Harris, D.; Olechno, J. et al. Gradient, contact-free volume transfers minimize compound loss in dose-response experiments. J. Biomol. Scr. 2010, 15, 86–94; doi: 10.1177/1087057109351027.
- Ekins, S.; Olechno, J. et al. Dispensing processes impact apparent biological activity as determined by computational and statistical analyses. PLoS ONE 8(5): e62325; http://www.plosone.org/article/info%3Adoi%2F10.1371%2Fjournal.pone.0062325; doi: 10.1371/journal.pone.0062325; 2013.
- Barlaam, B.C.; Ducray, R. 2,4-Diamino-pyrimidine derivatives. WO 2009/010794 A1, 2009.
- Barlaam, B.C.; Ducray, R. et al. Pyrimidine derivatives for inhibiting Eph receptors. U.S. 7,718,653 B2, 2010.
- Barlaam, B.C.; Ducray, R. N'-(phenyl)-N-(morpholin-4-yl-pyridin-2-yl)-pyrimidine-2,4-diaminederivatives as EPHB4 kinase inhibitors for the treatment of proliferative conditions. WO 2008/132505 A1, 2008.
- Bardelle, C.; Cross, D. et al. Inhibitors of the tyrosine kinase EphB4. Part 1: structure-based design and optimization of a series of 2,4-bis-anilinopyrimidines. Bioorg. Med. Chem. Lett. 2008, 18, 2776–80; doi: 10.1016/j.bmcl.2008.04.015.
- Bardelle, C.; Coleman, T. et al. Inhibitors of the tyrosine kinase EphB4. Part 2: structure-based discovery and optimisation of 3,5-bis substituted anilinopyrimidines. Bioorg. Med. Chem. Lett. 2008, 18, 5717–21; doi: 10.1016/j.bmcl.2008.09.087.
- Bardelle, C.; Barlaam, B. et al. Inhibitors of the tyrosine kinase EphB4. Part 3: identification of non-benzodioxole-based kinase inhibitors. Bioorg. Med. Chem. Lett. 2010, 20, 6242–5; doi: 10.1016/j.bmcl.2010.08.100.
- Barlaam, B.; Ducray, R. et al. Inhibitors of the tyrosine kinase EphB4. Part 4: discovery and optimization of a benzylic alcohol series. Bioorg. Med. Chem. Lett. 2011,21, 2207–11; doi: 10.1016/j.bmcl.2011.03.009.
- Wingfield, J. Impact of acoustic dispensing on data quality in HTS and hit confirmation. J. Drug Discov. 2012, Manchester, U.K.
- Spicer, T.; Fitzgerald, Y. et al. Pharmacological evaluation of different compound dilution and transfer paradigms on an enzyme assay in low volume 384-well format. Drug Discov. Tech. 2005, Boston, MA.
Joe Olechno and Mark Fischer-Colbrie are with Labcyte Inc., 1190 Borregas Ave., Sunnyvale, CA 94089, U.S.A.; tel.: 408-747-2000, ext. 161; e-mail: [email protected]; www.labcyte.com. Sean Ekins is with Collaborations in Chemistry, Fuquay-Varina, NC, U.S.A. Antony J. Williams is with the Royal Society of Chemistry, Wake Forest, NC, U.S.A.