Differential scanning calorimetry (DSC) has been the primary thermal analysis tool since its inception many decades ago. There are two main advantages of DSC over dynamic thermal analysis (DTA): the signal is quantitative in heat flow and the sample is encapsulated in a disposable aluminum crucible. There is no doubt that the quantitative heat flow is a big improvement over DTA and has led to the widespread use of DSC today. Some information was lost with the aluminum crucible: the sample cannot be seen as easily after the experiment as when it was in a glass capillary used for the DTA experiments. Often, the crucible is cut open after the DSC experiment to see if the sample has changed. Changes can include discoloration due to decomposition or weight change due to evaporation. If the sample did change during the experiment, we are left to ponder, “Where in the DSC experiment did this change occur?”
With the advent of high-resolution charge-coupled device (CCD) cameras, magnifying optics, and windows, it is now possible to record a video of the sample during the DSC experiment and retain the low-noise, high-quality DSC experiment. This technology is now offered with either the high-pressure DSC or the standard DSC. It can be retrofitted onto any Mettler-Toledo, Inc. (Columbus, OH) DSC. Applications will be shown that demonstrate the additional aid to interpretation that comes from recording a video of a sample simultaneously with the DSC experiment.
Experimental
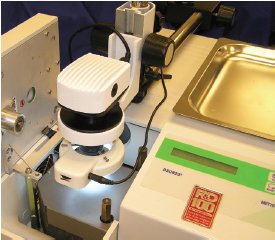
Figure 1 - Camera, lens, and ring light over the sample area of the DSC. The boom stand has enough adjustments to allow the camera to be moved out of the way for normal DSC operation.
The DSC823e (Mettler-Toledo, Inc.) was used without modification. The digital camera, magnification lens, and ring light were all held over the DSC cell by a stand (Figure 1). A special silver lid with quartz windows was used to let light into the DSC and retain the low noise in the heat flow signal. The camera was focused on the sample with a focusing knob. The light intensity can be adjusted for the different light reflection of different samples. The video images were sent to the computer using USB communications. The video acquisition software can be programmed to display the sample temperature in the upper-right corner of the video. Individual images can be saved from the video and pasted onto DSC plots, as shown in Figure 2.
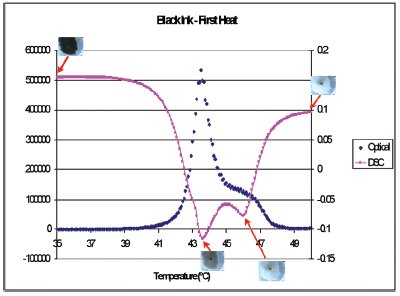
Figure 2 - Heat flow (pink squares) and the derivative of intensity (blue diamonds) during heating through the thermochromic transition of the black ink as well as images of the ink at different temperatures.
Application: Thermochromic paints
Thermochromic pigments change color at a specified temperature. These pigments are used in a variety of applications, such as industrial safety, automotive paints, fingernail polish, and marketing literature. The DSC is useful in measuring these transitions as melting points or glass transitions. This application evaluates the thermochromic transition of black ink from black to clear by both DSC and video microscopy. This black ink is used in printing applications. The ink is black at room temperature and is used to obscure printing underneath it. When one touches the ink, it becomes transparent, allowing the user to see the printing underneath. The DSC is used to measure the thermal events, and the video microscopy measures the reflected light intensity as the ink goes through its transition. The simultaneous recording of a video of thermochromic materials with the DSC experiment greatly assists in matching the thermal transition with the color change.
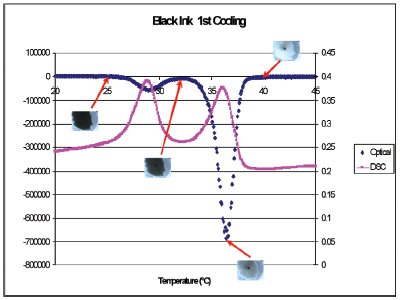
Figure 3 - Heat flow (pink squares) and the derivative of intensity (blue diamonds) during cooling through the thermochromic transition of the black ink as well as images of the ink at different temperatures.
Figure 2 shows the heat flow (pink squares) and the derivative of intensity (blue diamonds) during heating through the thermochromic transition of the black ink as well as images of the ink at different temperatures. The heat flow shows a double peak with maxima at 43.5 and 46 °C. The black ink turns gray by 43.5 °C but is not completely clear until 46 °C. Most of the exothermic heat flow is associated with the first peak. Figure 3 shows the heat flow (pink squares) and the derivative of intensity (blue diamonds) during cooling through the thermochromic transition of the black ink as well as images of the ink at different temperatures. Again, the sample has started to turn gray at the minimum of the first peak at 36 °C, but does not turn completely black until 25 °C.
The results indicate that there is a time lag between the largest peak in the DSC and when the transition is complete by video microscopy. The authors believe that the polymer matrix requires time to reorganize to allow light to pass through. This is also confirmed by the application of body heat to the ink. The ink takes some time (several minutes) to become transparent. Further isothermal DSC–microscopy studies are needed at 38 °C (body temperature) to study the kinetics of the color change.
Application: Nitinol—a shape memory alloy
Nitinol is an alloy of nickel and titanium. Nitinol is a shape memory alloy. It will return to the shape it was in when it was last annealed above 300 °C when it is heated above its transition temperature, 70 °C for this sample. Nitinol wire is used to make stents for angioplasty surgery. The wire is woven into a mesh tube. The tube is held open and annealed above 300 °C and cooled. The stent is then compacted so that it can be slipped through blood vessels. When the stent is in place, a small electrical current is sent down the stent wire. The resistive heating of the wire causes it to open back to its full open diameter. The stent is then left in place to hold the blood vessel open. The DSC is used to measure the phase transitions of nitinol, but it cannot “see” the memory transition. The nitinol wire will change shape above 70 °C back to its shape when it was last annealed. A video of wire taken simultaneously with a DSC experiment will show where the fiber is moving during the DSC experiment. DSC transitions can then be assigned to shape memory transition. This application studies the shape memory transition of nitinol from straight wire to curved wire by both DSC and video microscopy. The DSC is used to measure the thermal events, and the video microscopy measures the wire as it bends back to its memory form.
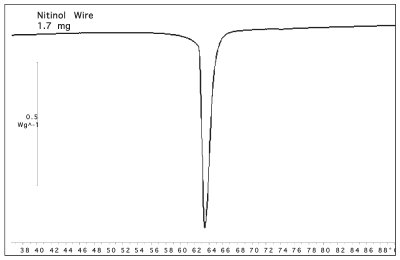
Figure 4 - DSC scan of 1.7 mg of nitinol wire. The endothermic transition is a result of the wire changing back to its memory shape.
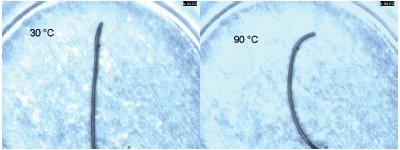
Figure 5 - Wire before (30 °C on left) and after (90 °C on right) the DSC scan. The sample was bent into a circle and annealed. The sample was then straightened at room temperature (on left). The sample then returns to its memory shape (arc on right) after being heated through the transition temperature.
The DSC curve for a 1.7-mg sample of nitinol wire is shown in Figure 4. The sample begins its transition at about 60 °C and finishes at about 68 °C. This nitinol sample was specified to have the transition at 70 °C. The end use of the wire requires knowledge of the temperature where the transition is complete, hence the 70 °C specification. Figure 5 shows two photographs of the sample before the experiment (30 °C) and after the experiment (90 °C). The sample was bent into a circle and annealed. The sample was then straightened at room temperature. A short piece of the circle (an arc) was cut for use in the DSC (shown on left side of Figure 5). The sample then returned to its memory shape, an arc (on right), after being heated through the transition temperature. Another measure of the shape memory transition is the distance between the ends of the wire. Photographs were saved from the video at intervals through the experiment. The ends of the wire were determined with the X and Y pixel value. The distance between the ends, L, was calculated using the equation below.
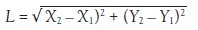
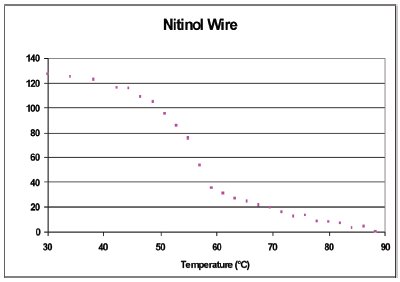
Figure 6 - Plot of the distance between the ends of the wire. The distance was measured from individual photographs taken from the video.
This distance, in pixels, is plotted in Figure 6. The largest change in the curvature (length) happens at the onset of the transition as measured by DSC heat flow. This DSC–microscopy study shows that the mechanical change in the nitinol wire occurs just prior to the endothermic transition as measured by the DSC.
Application: Oxidation of paper
All hydrocarbon materials will oxidatively decompose during heating in air or oxygen. This testing is normally done by thermogravimetric analysis (TGA) because the decomposition gases are slightly acidic and corrosive to DSC sensors made of metal, and the heat flow of oxidation is confounded with other transitions. The DSC823e uses a ceramic sensor with 120 thermocouples for high sensitivity and corrosion resistance. With the advent of high-resolution CCD cameras, we can now see the sample change colors as it decomposes in the crucible during the DSC experiment. A video of sample taken simultaneously with a DSC experiment will show us the temperature where the sample starts changing colors during decomposition. The microscopic observation of the sample, while it is heated in the DSC, gives the scientist additional information to be used in interpreting the DSC results.
The sample in this experiment was a disk of standard printer paper with the letter “A” printed on it for reference. The sample was placed in an open 40-μL pure aluminum crucible. The DSC cell was purged with 50 mL/min of oxygen gas. The sample was heated from 50 °C to 400 °C at 10 °C/min.
Figure 7 - Heat flow during paper oxidation in oxygen as well as images of the paper at different temperatures.
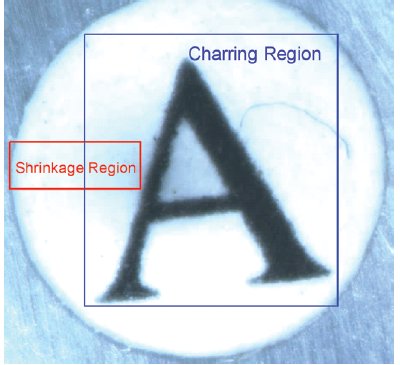
Figure 8 - Sample showing the shrinkage analysis region (red) and the charring analysis region (blue).
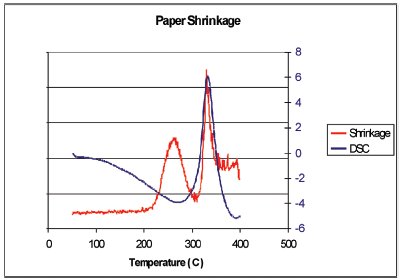
Figure 9 - Graph of the shrinkage results (red line) versus the DSC curve (blue line). In the Relative Motion scale, up is more motion.
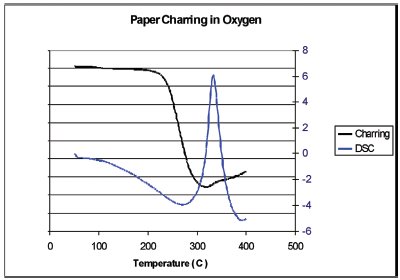
Figure 10 - Results of the charring analysis (black line) along with the DSC curve (blue line). In this case the relative intensity of the reflected light is being plotted. This value is high at the beginning of the experiment because the sample is still white.
The results of this experiment are summarized in Figure 7. The sample shows endothermic heat flow from the start (50 °C) to about 300 °C, when it turns exothermic; then it returns to the baseline at around 380 °C. Normally one would interpret this DSC curve as evaporation of volatiles to 300 °C, and then exothermic combustion until the end of the scan. New information from the video and the still photographs in Figure 7 give a different interpretation. Although not shown here, the video shows that black spots appear on the sample as low as 200 °C. The paper turns dark gray up to 300 °C. This indicates that the heat of evaporation of decomposition products (endotherm) is larger than the heat of oxidation (exothermic). Next, the sample is seen shrinking as it goes through an exothermic transition, 300–380 °C. The shrinkage could never have been determined by the DSC alone. The video analysis was performed on the shrinkage region in Figure 8. This region was selected because the brown charred paper (low light reflectance) moves through this region as the sample shrinks and exposes the aluminum crucible (high light reflectance). A graph of the shrinkage results (red line) versus the DSC curve (blue line) is shown in Figure 9. In the Relative Motion scale, up is more motion. The relative motion also captures the charring, peak at 260 °C, since the color change that accompanies charring gives the same response as motion, a sum of change in the pixel intensity and color. Also notice that the shrinkage, 340 °C, is associated with an exothermic heat flow. Charring, as shown in the blue box of Figure 8, is better observed using a region that will always contain the sample. The results of the charring analysis (black line) along with the DSC curve (blue line) are shown in Figure 10. In this case, the relative intensity of the reflected light is being plotted. This value is high at the beginning of the experiment because the sample is still white. The rapid decrease at about 260 °C is due to the color change as the paper chars. From this figure, it can also be seen that the charring is associated with an endothermic heat flow.
It can be surmised that the charring of paper is endothermic in nature. The heat of evaporation of the oxidation products (endothermic) is greater than the heat of reaction (exothermic). Additionally, the shrinkage area is exothermic; thus the heat of reaction is greater than the heat of evaporation.
Summary
Video microscopy is an important ancillary tool for the DSC. The sample images provide much-needed information that can help interpret the DSC results. This tool is easy to use and should find universal acceptance with all DSC users.
The authors are with Mettler-Toledo, Inc., 1900 Polaris Pkwy., Columbus, OH 43240, U.S.A.; tel.: 800-METTLER; fax: 614-985-9094; e-mail: [email protected].