Analytical pyrolysis has been used for decades in the analysis of polymeric materials with techniques not typically compatible with polymers,1 such as gas chromatography and mass spectrometry. The polymer is converted to smaller molecules, which are capable of being handled by the GC or MS, by the application of heat. The polymer is then studied by analyzing the fragments made during the pyrolysis step. The pyrogram resulting from the analysis of a typical complex polymeric material, such as a piece of chewing gum, natural rubber, packaging products, or paints, may contain a multitude of peaks. Interspersed with the polymer fragments are other compounds from the sample. These materials are volatilized during the pyrolysis process, but are not part of the polymer itself, and appear intact. Some of these compounds could be extracted before the pyrolysis of the polymer, but this would introduce solvents, dilute the analysis, and require additional sample handling. A simpler approach is to perform thermal extraction or desorption steps at lower temperatures prior to the pyrolysis.2 The compounds seen in these preliminary steps are volatile or semivolatile compounds, usually either contaminants or additives, which can then be analyzed independent of the polymer pyrolysis products.
Experimental
All samples were analyzed using a Pyroprobe 5250 (CDS Analytical, Oxford, PA) interfaced to a Clarus 500 GC-MS (PerkinElmer, Inc., Shelton, CT). Samples of about 100 μg were placed into a quartz tube, which was then dropped into the platinum coil of the Pyroprobe and heated to the desired temperature (Table 1). Multiple runs on the same sample could be performed sequentially by programming the Pyroprobe to retain the sample tube in the pyrolysis chamber between runs, then discharge it and clean the chamber at the end of the sampling sequence.
Chewing gum
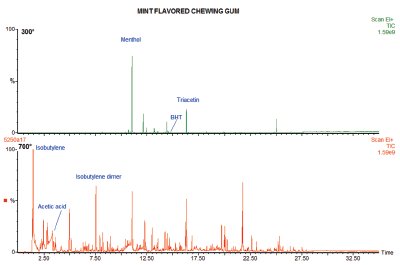
Figure 1 - Two-step analysis of mint-flavored chewing gum. Desorption at 300 °C (top) followed by pyrolysis at 700 °C (bottom).
If, instead of a single run, as is typical in many pyrolysis experiments, a sample of chewing gum were heated first to 300 °C to volatilize the nonpolymeric content, then at 700 °C to examine the polymer, the result would separate the organics into two groups. In the first run, flavorings like menthol and fruit esters are desorbed from the gum base, as well as the plasticizers such as triacetin and antioxidants such as butylated hydroxytoluene (BHT). An example of this can be seen in the top chromatogram in Figure 1. This is a sugar-free, mint-flavored gum, and at 300 °C the flavoring (menthol), the plasticizer (triacetin), and the antioxidant (BHT) are prominent.
In the pyrolysis run, the remaining polymer (the gum base) produces peaks that indicate the kind of polymers used to make it. In many cases, acetic acid and aromatics like benzene and toluene are produced, indicative of polyvinyl acetate, while the monomer and dimer (and higher oligomers) of isobutylene would show that the gum base was formulated using polyisobutylene. It is actually common for a gum base to be an isobutylene/vinyl acetate copolymer, in which case pyrolysis products would be seen from both of the polymers involved. The lower chromatogram in Figure 1 shows this, with a peak for acetic acid and the monomer, dimer, and higher oligomers of isobutylene making up most of the pyrogram.
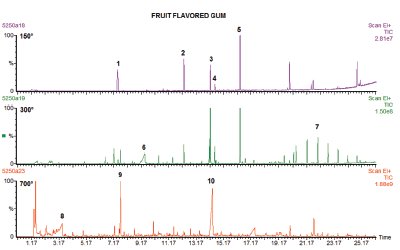
Figure 2 - Tri-step analysis of chewing gum at 150, 300, and 700 °C. For peak identification, see Table 2.
Figure 2 shows a three-step analysis of another typical chewing gum. In this case, the gum is fruit flavored, and at 150 °C several flavoring ingredients are seen, including limonene and cinnamaldehyde. Identification of the numbered peaks in Figures 2–4 are found in Table 2.
At 300 °C several new peaks are seen, which are additives, including glycerin and a series of hydrocarbons indicating a paraffin wax.
When the sample is pyrolyzed, several large furancarboxaldehyde derivative peaks appear, which result from the pyrolysis of sugars. In the case of sugar-free gums, like the one shown in Figure 1, these peaks are not present, but the artificial sweetener used may be. In addition, acetic acid is seen, again indicating that polyvinyl acetate is used in the gum-base polymer.
Natural rubber
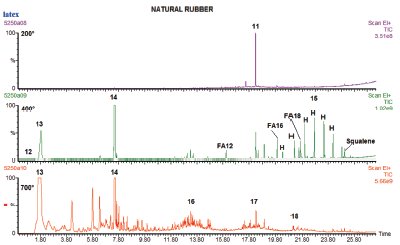
Figure 3 - Tri-step analysis of natural rubber at 200, 400, and 700 °C. FA = fatty acid and H marks normal hydrocarbon from paraffin wax.
Rubbers were one of the first types of materials analyzed using pyrolysis, and are still one of the most common.3 The sample used to generate the chromatograms in Figure 3 was taken from a natural latex rubber glove. When heated to 200 °C, one large peak was produced, which was a plasticizer, diethyl phthalate.
At 400 °C the rubber is beginning to degrade, and both the monomer (isoprene) and dimer are seen. In addition, a small peak is seen for carbon disulfide early in the chromatogram. Eluting later is a series of peaks that make up a distribution of hydrocarbons, specifically paraffins. There are also small peaks for fatty acids in the same region as the paraffins. These are at least in part contamination peaks, since squalene was also found, indicating finger oil, but fatty acids and waxes are also used in mold-release compounds to help remove molded polymer products in manufacture. In this chromatogram, normal hydrocarbons marked “H,” the fatty acids marked “FA,” and squalene are identified. Specifically, FA12 is a fatty acid containing 12 carbon atoms, FA 16 contains 16, and FA18 contains 18.
At 700 °C the remaining polymer is pyrolyzed, producing the pattern typical for natural rubber. In addition to the monomer and dimer of isoprene, there are multiple compounds consisting of three, four, and five isoprene units.
Packaging
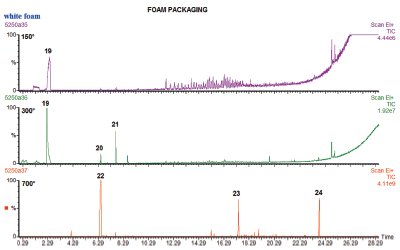
Figure 4 - Tri-step analysis of polystyrene foam packing material at 150, 300, and 700 °C.
Figure 4 shows the volatiles released from a sample of white foam packaging, the type used to make the little molded cushions for protecting breakable parts in shipping. Only one very small peak of interest, early in the chromatogram, is seen. This peak is identified as cyclohexane. When the same sample is heated again to 300 °C, a much larger peak of cyclohexane is seen. The preliminary run at such a low temperature is useful in verifying that the compound seen at 300 °C is not a degradation peak from the polymer, but a desorbed compound, since it was present even at such a low temperature in the first run of the sample. At 300 °C a few other small peaks are also seen, as identified in Table 2. Finally, when the packaging is pyrolyzed, styrene monomer, dimer, and trimer are produced, identifying the material as a polystyrene foam, in which the hydrocarbon was used as a blowing agent.
Conclusion
Much of the work formerly done by solvent extraction to characterize polymeric systems may be done with better sensitivity using thermal sample preparation instead. At lower temperatures, the polymer is not degraded, but adsorbed or retained compounds are released and may be studied and identified. These compounds represent a wide array of volatile and semivolatile compounds, including solvents, plasticizers, antioxidants, flavoring agents, and residual monomers. After these analytes have been removed from the sample, it may be pyrolyzed to identify the makeup of the polymer itself.
References
- Blazso, M. Recent trends in analytical and applied pyrolysis of polymers. J.Anal. Appl. Pyrolysis1997, 39, 1–25.
- Wampler, T. Temperature as a sample preparation tool in the analysis of materials by GC-MS. LC·GC 1999, 17, 14–18.
- Phair, M. Analysis of rubber materials by pyrolysis-GC. Rubber World1997, Feb, 30–4.
Mr. Wampler is Director of Science and Technology, and Mr. Zawodny and Ms. Jansson are Application Chemists, CDS Analytical, Inc., 465 Limestone Rd., Oxford, PA 19363, U.S.A.; tel.: 610-932-3636; fax: 610-932- 4158; e-mail: [email protected].