Successfully manipulating the rheology of a product during its development enables formulators to deliver desirable characteristics—the right feel and texture, great stability, and optimal usability that suits the consumer, to name just a few. Yield stress is often a key parameter for materials ranging from food to paint, from coatings to personal care. Here, John Duffy, Product Technical Specialist for Rheology at Malvern Instruments (Worcestershire, U.K.), examines this important property, its industrial relevance, and how it can be measured accurately.
What is yield stress and why is it of industrial interest?
Many industrially significant materials exhibit solid- or gel-like behavior at rest, but begin to flow once applied shear exceeds a certain threshold value. These systems are described as exhibiting a yield stress marking the transition from solid- to liquid-like behavior. If the applied stress is less than the yield stress, then the material deforms elastically, like a spring stretching, but once the yield stress is exceeded, it flows like a liquid.
Easily recognized examples from the personal care and food industries illustrate this phenomenon. Tomato ketchup, for example, sits solid-like in the bottle and on the plate, but flows smoothly as it is squeezed from the bottle. Likewise, toothpaste remains largely confined in a tube, even when the top is left off, but is squeezed onto a brush with little effort, and then remains in place during use. For products such as mayonnaise and yogurt, higher yield stresses are associated with a thicker, creamier appearance and are therefore suggestive of better product quality, highlighting the economic benefit of an optimal yield stress.
Tailoring yield stress to confer desirable performance, and value, is consequently an important aspect of formulation. A suboptimal yield stress will result in unacceptable performance—ink that too readily drips from a printer, for example. Implicit in this statement, however, is the need to match yield stress to the conditions of use. Successful formulation is not simply a matter of engineering a yield stress, but rather of engineering a very specific value of yield stress, such that the product flows under exactly the right conditions when used.
Why do certain materials exhibit a yield stress?
Complex fluids, such as suspensions and emulsions, that have a yield stress, can be thought of as having a structural skeleton that extends through the entire system. The strength of this skeleton is governed by the structure of the dispersed phase and its interactions. Under low stresses, the skeleton becomes stretched, like a tensioned spring, causing strain hardening, but approaching the yield stress the structure begins to break down. The interactions that have induced solid- or gel-like behavior are overcome and liquid-like flow is established.
This breakdown is typically a reversible process since many systems are thixotropic, i.e., they have a structure that changes over time. Once the applied stress has been removed, the structure rebuilds—often very rapidly—returning the system to gel- or solid-like performance. Such behavior can have an impact on testing and needs to be carefully considered when developing an appropriate analytical protocol, especially when looking at the time scale over which testing is carried out.
One way to induce structural breakdown is to apply a relatively high stress over a short time frame, but breakdown may also occur over a much longer time frame, at a much lower stress. As a result, there is much debate over the concept of “true yield stress.” Some would argue that since almost all materials can creep or flow over long enough time scales, many systems that are considered to have a true yield stress are actually very high-viscosity liquids.
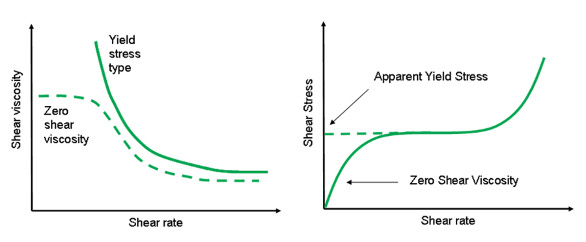
Figure 1 - A material with a true yield stress exhibits infinite viscosity at low shear rates, while one with an apparent yield stress has a zero shear viscosity plateau.
Widespread use of the term “apparent yield stress” is the pragmatic response to this issue. Apparent yield stress is defined as the critical stress above which there is a distinct drop in viscosity. Figure 1 contrasts the behavior of systems exhibiting either a true or apparent yield stress, and highlights the importance of low shear rate testing, since it is in this region that the two different types of behavior can be most easily distinguished.
This discussion raises the question of whether it is important or necessary to establish true yield stress values, or whether measuring apparent yield stress is an adequate approach. The answer depends on the conditions of interest. Returning to the example of toothpaste, desirable performance requires a rapid fall in viscosity with the application of a moderate shear stress. Determining that the system has an apparent yield stress at moderate shear rates may therefore be sufficient. If, on the other hand, it is behavior under low stress over long time scales that is of interest—the stability of a paint in storage, for example—then identifying a true yield stress may be important.
In summary, then, like so many rheological tests, accurate yield stress characterization relies on applying relevant test conditions. And not just in terms of the time scale used. Temperature, too, can have a major impact. At higher temperatures, systems have higher thermal energy and will therefore tend to flow more readily. This must be taken into account when considering test conditions.
What equipment is needed to measure yield stress and what methodologies are applied?
The impact of factors such as time scale, temperature, and thixotropy makes the determination of yield stress as a true material constant quite difficult. There is no single universal method for testing, and the results measured depend on the technique employed. Some testing is relatively crude, as exemplified by the slump and inclined plane tests; at the other end of the spectrum is the rotational rheometer, a sophisticated instrument for reliable, precise yield stress characterization. Compared even with a viscometer, rotational rheometers offer more functionality and versatility for yield stress measurement, the facility for oscillatory testing being particularly important.
With a rotational rheometer, a wide range of different test methodologies can be applied to probe the yield stress characteristics of a sample, making it logical to ask: Which technique is most suitable for this sample? Unfortunately there is not a simple answer. Some methods are found to be especially suitable for a given product and become the technique of choice within a specific industry, but more generally it is necessary to review and/or apply different methods and select one on the basis of either relevance or practicality. Understanding the different methods available is crucial to making an informed choice.
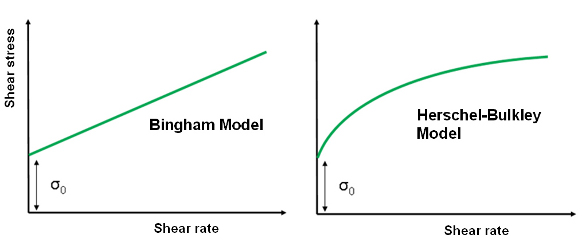
Figure 2 - Fitting an appropriate model enables the determination of shear stress at zero shear rate—the yield stress σ0.
Model fitting is the traditional method for yield stress measurement and can be carried out using either a viscometer or a rotational rheometer, the main difference being that the viscometer will tend to have a more limited stress/strain rate range. Models are fitted to plots of shear stress versus shear rate (see Figure 2), with the selected model depending on the type of system under test.
The Bingham model is the simplest, and is well-suited to materials that exhibit nearly Newtonian flow behavior above the yield stress. The alternative Casson model has a more gradual transition between the yield and Newtonian regions and is particularly applicable to products such as ink and chocolate. In contrast to both of the preceding models, the Herschel-Bulkley model describes non-Newtonian flow, post-yielding, providing a useful alternative for systems that exhibit this behavior.
The most suitable model can be identified by comparing goodness-of-fit data, but it is worth noting that one model may give a better fit for low shear rate data, and another at higher shear rates. Measurement range should therefore be selected to simulate the conditions of interest for the product.
It is also important to recognize that the yield stress values determined by model fitting are often termed dynamic yield stresses, distinguishing them from the static yield stress values generated by other techniques. Dynamic yield stress is defined as the minimum stress required for maintaining flow, while the static yield stress is the stress required to initiate flow; typically a higher value. Static yield stress data are most applicable when looking at initiating flow in a material, for example, in pumping, while dynamic yield stress values may be more applicable in applications for maintaining or stopping flow after initiation.
Stress ramp
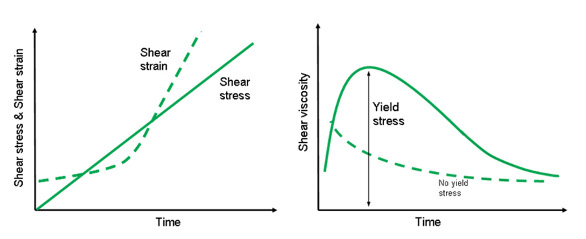
Figure 3 - Ramping up shear stress and measuring the stress at which a peak in viscosity occurs to access yield stress data.
One of the quickest and easiest ways of directly measuring yield stress is to ramp up stress until a peak viscosity is observed (see Figure 3). Prior to this peak, the sample is undergoing elastic deformation, so the peak exactly coincides with application of the yield stress, the stress at which the sample structure breaks down and the material begins to flow.
As mentioned previously, yield stress behavior can be time dependent, and therefore the stress ramp rate is a critical factor—with the use of a standard or constant value necessary to be able to make comparisons across samples.
Stress growth
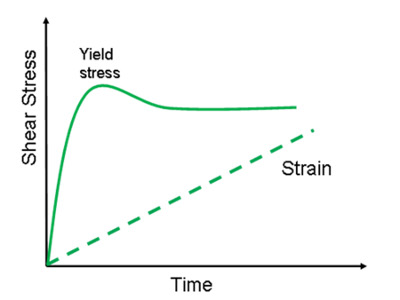
Figure 4 - Ramping up strain (applying constant shear rate) and following the evolution of stress to access yield stress data.
An alternative ramp method is stress growth—whereby a constantly increasing strain (constant shear rate) is applied, and the resultant stress buildup is monitored as a function of time. When the critical strain in the sample is reached, the structure breaks down and the material begins to flow, as evidenced by a peak in the shear stress (see Figure 4).
Typically a low shear rate is applied (0.01 s-1 is commonly used), although different shear rates can be used to adapt to the application in question. Slower ramping will be more reflective of behavior over long time periods, such as storage or sedimentation performance. Steeper ramping, on the other hand, will generate data of more relevance to faster processes such as dispensing.
Oscillatory testing
Oscillatory techniques, the application of sinusoidal displacement, are the best way to study the microstructural relaxation processes that give rise to time-dependent behavior. These techniques offer a more consistent approach for static yield stress determination than is provided by steady shear methods, especially for systems with a low yield stress.
Oscillatory testing characterizes the viscoelastic nature of a sample using the elastic modulus, G’, and the viscous modulus, G”, and can be carried out at various frequencies to assess performance over different time scales. When the value of G’ exceeds that of G”, elastic response is dominant, which means that the sample is behaving as a solid or gel. Conversely, when G” is greater than G’, viscous liquid-like behavior is prevailing. Lower test frequencies are preferable for assessing behavior over long time scales, but increase the time taken for testing. Practicalities therefore dictate that most oscillatory testing is carried out at frequencies in the range 0.01–10 Hz.
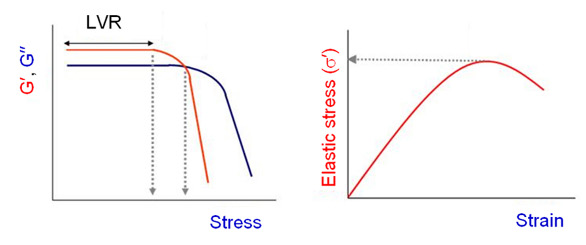
Figure 5 - Output of oscillation amplitude tests to evaluate yield stress (LVR: linear viscoelastic region).
Yield stress measurement via oscillatory testing involves applying an increasing oscillatory stress or strain (amplitude sweep) and monitoring the change in viscoelastic moduli with increasing amplitude (see Figure 5). Some practitioners identify yield stress from a sharp drop in G’, but others argue that it is the cross-over point where G” becomes larger than G’ that marks the transition from solid (elastic) to liquid (viscous) behavior. Both arguments have merit, so the zone spanning these two values is frequently referred to as the yield zone.
An alternative, more recent, method for determining yield stress by means of oscillation testing involves measuring the elastic stress component (σ’), which is associated with the elastic modulus (G’), as a function of strain amplitude.1,2 The yield stress is the peak value of the elastic stress, and the corresponding strain value is the yield strain. This method tends to give values centered in the yield zone and typically shows close agreement with other protocols.
Multiple creep
Multiple creep testing is widely recognized as one of the most accurate ways of determining yield stress. It involves applying a series of stresses, and looking for changes in the gradient of the compliance versus time curve.
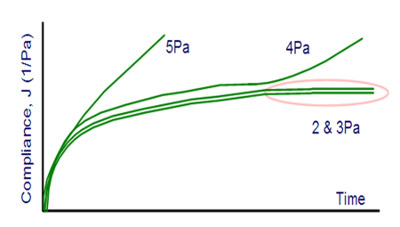
Figure 6 - At the yield stress, in this case between 3 and 4 Pa, the compliance curve begins to deviate from the LVR baseline.
Multiple creep testing, across a range of applied stresses, produces a series of compliance curves that overlie one another at stresses below the yield stress, i.e., when the applied stress is within the linear viscoelastic region (LVR) of the material. At higher applied stresses, above the yield stress, the compliance curve begins to deviate from this LVR baseline (see Figure 6) as liquid-like behavior begins to dominate and the material flows.
As with other test methods, the time scale over which testing is carried out can be critical, as illustrated by the results in Figure 6. Here, a short test time would have identified a yield stress of 5 rather than 4 Pa, since the material yields instantaneously at 5 Pa, but only after a given time at 4 Pa. The relaxation time allowed between tests is also important and should be carefully chosen to reflect the thixotropic characteristics of the sample. The multiple iterations that creep testing requires, as well as the need for manual analysis and judgment and some prior knowledge of the sample, can make it ill-suited for routine use in an industrial environment, despite its accuracy.
Conclusion: Choosing an optimal yield stress measurement method
While the practical importance of yield stress is readily appreciated, yield stress measurement is a complex issue. For formulators, the key is to adopt practical strategies that deliver relevant results. Understanding the techniques and how they work is important, but so too are the practicalities of measurement, a topic covered in some detail in Ref. 3.
Choosing an optimal method for yield stress measurement requires an assessment of different methods to find the one best suited to the application and to the working environment. And this may change over time. For example, in the early stages of formulation, the yield stress characteristics of the system may be rigorously investigated using relatively lengthy practices, but as the project progresses, a certain amount of precision may be sacrificed to the practicalities of ease and/or analysis time. Such decisions demand a thorough understanding of the issues surrounding yield stress measurement, knowledge that more broadly supports the optimal formulation of complex fluids with desirable performance characteristics.
References
- Yang, M.C.; Scriven, L.E. et al. Some rheological measurements on magnetic iron oxide suspensions in silicone oil. J. Rheol. 1986, 30, 1015–29.
- Walls, H.J.; Caines, S.B. et al. Yield stress and wall slip phenomena in colloidal silica gels. J. Rheol. 2003, 47(4), 847.
- Duffy, J. White paper. Understanding Yield Stress Measurements; http://www.malvern.com/yield_stress.
John Duffy is Product Technical Specialist, Malvern Instruments Ltd., Enigma Business Park, Grovewood Rd., Malvern, Worcestershire WR14 1XZ, U.K.; tel.: +44 (0) 1684 892456; fax: +44 (0) 1684 892789; e-mail: [email protected] www.malvern.com.