Quantitative bioanalysis is the most
important application area of liquid chromatography coupled with atmospheric pressure ionization (API) tandem mass spectrometric detection
(LC-API-MS-MS) in terms of the
number of instruments employed and
the number of analyses performed.1
The most commonly used API
sources are electrospray ionization (ESI) or Ionspray™ (pneumatically
assisted electrospray) (Applied
Biosystems/MDS Sciex, Foster City,
CA) and atmospheric pressure chemical ionization (APCI). While ESI is
suitable for polar and chargeable
molecules and APCI expands the
range of application to less polar compounds,
the analysis of neutral and
nonpolar compounds is challenging
due to their poor ionization efficiency.
Several strategies to overcome the
limitations of ESI and APCI sources
have evolved, including chemical
derivatization,2 coordination-ion-spray,3 and atmospheric pressure
photon ionization.4 In another
approach, the attachment of small
organic or inorganic ions to a neutral
molecule is an important ionization
mechanism in both positive
and negative ion ESI mass spectrometry,
and adduct ion formation
is a frequently observed phenomenon
in mass spectra originating
from the ESI process. This article
presents the application of an
anion attachment strategy for
detecting two neutral molecules
(Pfizer compound A and Pfizer compound
B) in biological matrices.
Although the compounds give poor
ionization efficiencies with both
ESI and APCI sources, they form
anionic adduct ions with a variety
of anions, including formate and
acetate, when an ESI source is used.
In negative ion multiple reaction
monitoring (MRM) mode, the formate
adduct ions of the compounds
are selected in the first quadrupole
(Q1), fragmented in the second
quadrupole (Q2), and the dissociated
formate ions are detected in the
third quadrupole (Q3). The anion
attachment strategy shown here
offers a very simple and effective
way to improve the performance of
the LC-ESI-MS-MS methods for
certain neutral molecules without
derivatization reactions to enhance
analyte ionization efficiencies. A
sensitive, high-throughput LC-ESI-MS-MS method has been developed
for detecting ESI mass spectrometry-insensitive compounds in
biological matrices using an anion
attachment strategy.
Experimental
Chemicals and reagents
Pfizer compound A (MW 287) and
Pfizer compound B (MW 294) were
synthesized by Pfizer Global
Research and Development (Ann
Arbor, MI). Formic acid (88%, analytical
grade [AR]) and 50% ammonium
hydroxide (AR grade) were
obtained from Mallinckrodt Baker
(Phillipsburg, NJ). Protein precipitation
filter plates (96-well) were
obtained from Whatman Inc.
(Florham Park, NJ). All HPLC-grade
solvents were obtained from
Mallinckrodt Baker (Paris, KY).
Various lots of rat and monkey
plasma with K3EDTA as the anticoagulant
were purchased from
Bioreclamation (East Meadow, NY).
The LC-MS-MS system consisted of a
CTC PAL autosampler (CTC Analytics,
Zwingen, Switzerland), an integrated
pump system consisting of LC-10AD pumps with an SCL-10A
system controller and a DGU-14A
degasser (Shimadzu, Kyoto, Japan),
and an API 4000 triple quadrupole mass spectrometer (Applied Biosystems/MDS Sciex).
Chromatographic separations were
performed on a 50 mm × 2.1 mm i.d.,
3-μm, Thermo Hypersil Gold C18 column (Thermo Electron Corp.,
San Jose, CA) using gradient elution
at a flow rate of 300 μL/min. Mobile phase A and B were 2 mM formic acid
and methanol, respectively. All tubing
connections were polyetherether
ketone (PEEK) with 0.005-in. i.d. The
mass spectrometer was operated in
negative ion MRM mode for quantitative
work. In order to establish the appropriate MRM conditions for
Pfizer compounds A and B, solutions
of the standards (1.00 μg/mL in
methanol) were infused into the mass
spectrometer, and mass spectrometric
parameters such as declustering potential
(DP) and collision energy (CE)
were optimized to maximize the intensities
of the proposed anionic adduct
ions and the corresponding product
ions. Collision-induced dissociation
(CID) mass transitions of m/z 332 →
45 and m/z 339 → 45 were monitored
for Pfizer compound A and Pfizer compound
B, respectively. The dwell time
was 200 msec for each mass transition.
Preparation of calibration
standards and validation
samples
The stock solutions of Pfizer compounds
A and B were prepared by
dissolving appropriate amounts of
solid material (typically 10 mg) in
dimethyl sulfoxide (DMSO) to
give concentrations of 1.0 mg/mL,
respectively. The stock solutions
were used to prepare the calibration
standards in rat plasma at concentrations
of 0.100, 0.200, 1.00,
5.00, 10.0, 50.0, 90.0, and 100
ng/mL for Pfizer compound A, and
concentrations of 0.400, 0.800,
2.00, 20.0, 100, 200, 360, and 400
ng/mL for Pfizer compound B. Similarly, quality control samples
(QCs) were prepared from separate
weighings at concentrations of
0.100, 0.300, 5.00, and 80.0 ng/mL
(Pfizer compound A), and concentrations
of 0.400, 1.00, 20.0, and
320 ng/mL (Pfizer compound B),
respectively. For the Pfizer compound
A assay, an acetonitrile
solution of 10.0 ng/mL Pfizer compound
B was used as the working
internal standard solution (WISS)
and vice versa. The DMSO stock
solutions were stored at 4 °C, and
the plasma samples were stored
frozen at –20 °C.
Sample preparation
Plasma samples were thawed to
room temperature, then vortexed
to render the thawed sample
homogeneous . Plasma samples
(100 μL each) were transferred to a
96-well protein precipitation filter
plate (Whatman) containing 300
μL of the working internal standard
solution. The filtrates were
evaporated to dryness under a
stream of nitrogen at 37 °C, and
the dry residues were reconstituted
in 100 μL of methanol /water
(30/70, v/v) solution. Sample
extracts (10.0 μL) were injected
for LC-MS-MS analysis.
Results and discussion
ESI mass spectrum
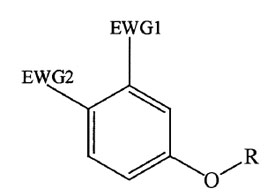
Figure 1 - General chemical structure of
Pfizer compounds A and B.
Pfizer compound A and Pfizer compound
B are among a group of analogous
molecules that have the following
common chemical structure
(Figure 1): two electron withdrawing
groups (EWGs) on a phenyl
ring and an ether linkage to an
alkyl group. They do not contain
ionic or chargeable functional
groups such as amino and carboxylic acid groups that can be ionized
in ESI or APCI sources.
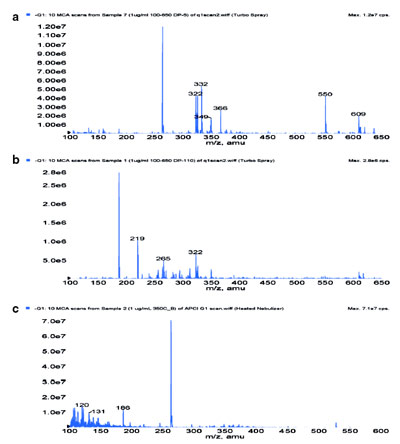
Figure 2 - Negative ion mass spectra of Pfizer compound A using a)
ESI at DP 5 V, b) ESI at DP 110 V, and c) APCI at 350 °C.
Figure 2 shows typical mass spectrometric full scans of Pfizer compound
A in negative ion mode
under various ionization conditions
including ESI and APCI . The
molecule has a molecular weight of
287 (MW 287) . Molecular ions
[M+1]+ in positive ion mode (MS
spectra not shown) and [M–1]– in
negative ion mode were not
observed. This is not surprising,
since the compound contains no
chargeable functional groups.
However, using ESI in negative ion
mode and at low declustering
potential (DP 5 V), characteristic
ions at m/z 322, 332, 349,
366, and 550 (Figure 2a)
were observed. These negative ions appeared as the
compound was infused and
disappeared as the infusion
was stopped. It was later
confirmed that these negative
ions were adduct ions
formed between Pfizer compound
A with residue anions
such as Cl–, HCOO–, NO3–,
Br–, and C4F9COO–, respectively.
The presence of two
EWG groups (EWG1 and
EWG2) on the aromatic ring
makes the molecule a good
π -acid for forming charge
transfer complexes with
small anions. Trace amounts
of anions (~1.0 ppm) are
commonly present in water
and other solvents. The signal
intensities of these
anionic adduct ions decreased as
the DP was increased from 5 V to
110 V (Figure2b), and no adduct
ions were observed when an APCI source was used (Figure 2c). The
intense peak of m/z 263 (Figure 2a
and 2c) is from residue nonafluoropentanoic
acid (C4F9COOH,
MW 264) that was an ion-pairing
reagent used for the analysis of a
polar compound in another LC-MS-MS assay. Nonafluoropentanoic
acid is difficult to remove
completely from the LC-MS-MS
system, even with extensive cleanup
procedures.
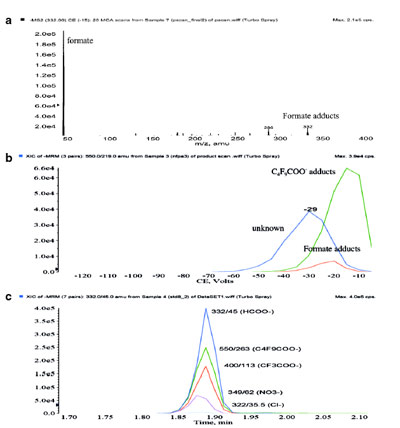
Figure 3 - a) CID mass spectrum of formate adduct ions of Pfizer
compound A, b) CID dissociation profiles, and c) MRM chromatograms
of various anionic adduct ions of Pfizer compound A.
Figure 3a shows a CID spectrum of
the adduct ions of Pfizer compound
A with formate. CID dissociation
profiles of the adduct ions of Pfizer
compound A with both formate and
C4F9COO– anions are shown in Figure
3b. MRM chromatograms of
several anionic adduct ions monitored
simultaneously are shown in
Figure 3c. The intensity of [M–1]–
ions (m/z 286) is very weak compared
to that of formate anions
since the ion–molecule association
between the formate anion and the
neutral molecule is noncovalent
and weaker than a typical covalent
bond (Figure 3a). Low collision
energies (CE less than 20 V) were
needed to break the ion–molecule
association (Figure 3b). As shown
in Figure 3c, anionic adduct ions of
Cl–, NO3
–, HCOO–, CF3COO–, and
C4F9COO– can be used for the
chromatographic detection of Pfizer
compound A by an alternative
means of tandem mass spectrometric
detection. The chromatographic
separation was carried out on a
reversed-phase column with gradient
elution using water and acetonitrile
as mobile phases. Initially,
C4F9COO– adduct ions with Pfizer
compound A for the MRM detection
(m/z 550 → 263) and subsequent
quantitation were chosen
because theoretically there are
fewer mass spectral interferences in
the higher mass range. The concentration
of the ion pairing reagent
(C4F9COOH) in the mobile phase
had to be within the range of
micromolar (μM) in order to have
low and stable background noises,
and it was found that the analyte
peak responses decreased after using
the LC-MS system for real plasma
samples or switching the LC-MS
system between different assays.
This might be caused by competition from other residue anions including formate, since the concentration of the ion-pairing
reagent (C4F9COOH) was low in
the μM range. Formate adduct ions
were chosen for the MRM detection
(m/z 332 → 45) and the subsequent
quantitation of Pfizer compound
A since formic acid is among
the most common buffers in LC-MS-MS analysis. It was found that
2 mM formic acid added to the
mobile phase provided enough formate
anions for the adduct ion formation
without elevating background
noise.
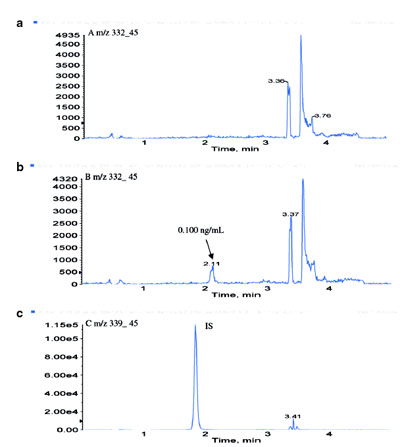
Figure 4 - LC-ESI-MS-MS chromatograms of a) blank rat plasma, b)
Pfizer compound A at 0.100 ng/mL in rat plasma, and c) internal standard
(Pfizer compound B), 10.0 ng/mL in rat plasma.
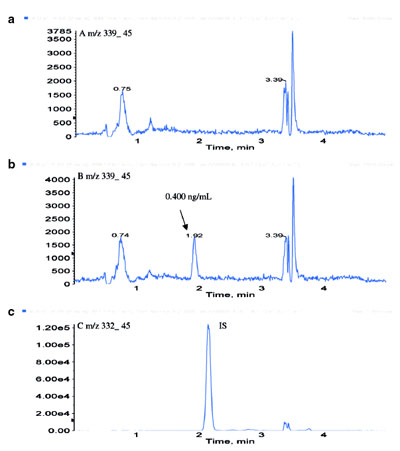
Figure 5 - LC-ESI-MS-MS chromatograms of a) blank rat plasma, b)
Pfizer compound B at 0.400 ng/mL in rat plasma, and c) internal standard
(Pfizer compound A), 10.0 ng/mL in rat plasma.
Previously, for Pfizer compound A, an
LC-ESI-MS-MS method using a conventional
approach could only achieve
a limit of quantitation (LOQ) of 200
ng/mL in rat plasma, and a GC-MS
method with an LOQ of 8.00 ng/mL
required liquid–liquid extraction for
sample cleanup. The use of the formate
adduct ions provides an alternative
means of tandem mass spectrometric
detection of the nonionic
compound, Pfizer compound A. As
shown in Figure 4, using formate anion
attachment, an LOQ of 0.100 ng/mL
of Pfizer compound A in rat plasma
was achieved. With a similar formate
anion attachment strategy, an LC-ESI-MS-MS assay was developed for Pfizer
compound B, a structural analog of
Pfizer compound A, at an LOQ of
0.400 ng/mL in rat plasma (Figure 5).
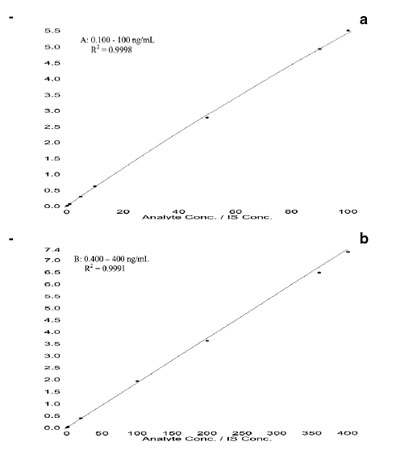
Figure 6 - Calibration standard curves for a) Pfizer
compound A (0.100–100 ng/mL) and b) Pfizer compound
B (0.400–400 ng/mL) in rat plasma.
These two LC-ESI-MS-MS methods
were successfully validated under the
authors’ Standard Operating Procedures
(SOPs), which are in conformance
with the current FDA guidelines
for bioanalytical method validation.5Figure 6 shows typical calibration standard
curves of these two compounds in
rat plasma, and the correlation coefficients
(R2) were >0.999 using a 1/concentration2
weighed quadratic regression
model. Using 100-μL aliquots of
rat plasma, assay concentration ranges
were validated from 0.100 to 100
ng/mL for Pfizer compound A and from
0.400 to 400 ng/mL for Pfizer compound
B (MW 294). Plasma sample
preparation was carried out using protein
precipitation with acetonitrile in a
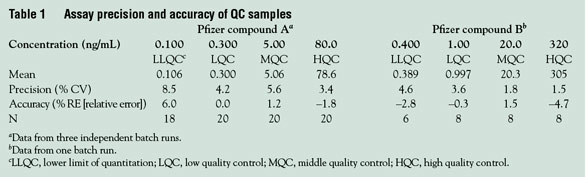
96-well filter. Some of the validation
results are presented in Table 1. The
data show that the two methods are
consistent and reliable with acceptable
values of precision and accuracy.
Application to preclinical
samples
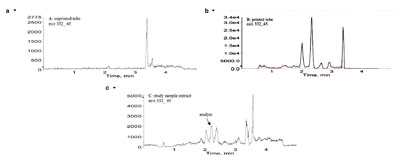
Figure 7 - LC-ESI-MS-MS chromatograms of a) a solvent blank in an unprinted tube, b) a solvent blank in a printed tube, and c) a study sample
extract (0.160 ng/mL).
Using the above LC-ESI-MS-MS
methods, over 1000 plasma samples
were analyzed from several preclinical
and toxicokinetic studies for Pfizer
compounds A and B. When analyzing
Pfizer compound A in rat plasma study
samples, two interfering peaks were observed close to the analyte peak.
Later it was possible to conclude that
the interfering peaks are related to the
printing ink materials on a typical
polypropylene sample tube (Figure 7a
and b). By carefully selecting sample
tubes that have no printed marks for
the work and by using a better chromatographic
separation, the authors
were able to keep the interfering
effects to a minimum. Figure 7c shows
an MRM chromatogram of a study
sample containing 0.160 ng/mL of
Pfizer compound A in rat plasma. For
those study samples with concentrations
close to the LOQ (0.100 ng/mL
in rat plasma), the interfering peaks
might affect the analyte integration
and quantitation.
Conclusion
LC-MS-MS analysis of neutral or
nonionic compounds is a challenging
area in a bioanalytical laboratory
supporting drug discovery and
development. The above two examples
demonstrate that an alternative approach of using formate
attachment can lead to sensitive
and selective LC-ESI-MS-MS
methods without involving time-consuming
procedures such as sample
derivatization or GC-MS-MS
analysis. Adduct ion formation is
very common in the ESI process,
and the use of adduct ions for LC-ESI-MS-MS quantitation can be
applied to other neutral compounds
and nonionic compounds.
References
- Niessen, W.M.A. J. Chromatogr. A1999, 856, 179–97.
- Van Berkel, G.J.; Quirke, J.M.E.;
Tigani, R.A.; Dilley, A.S.; Covey, T.R.
Anal. Chem. 1998, 70, 1544–54.
- Bayer, E.; Gfroer, P.; Rentel, C. Angew.
Chem. Int. Ed.1999, 38, 992–5.
- Robb, D.B.; Covey, T.R.; Bruins, A.P.
Anal. Chem.2000, 72, 3653.
- U.S. Food and Drug Administration/Center for Drug Evaluation and
Research, Guidance for Industry Bioanalytical
Method Validation,www.fda.gov/cder/guidance/index.htm.
The authors are with Pharmacokinetics,
Dynamics & Metabolism, Pfizer Global
Research and Development, Michigan
Laboratories, Pfizer Inc., 2800 Plymouth
Rd., Ann Arbor, MI 48105, U.S.A.; tel.:
734-622-4117; fax: 734-622-5115; e-mail: [email protected]. The authors thank
Mr. David Weller, Ms. Laura Penn, and Mr.
Michael Bass for their help in the early stages of
assay development. Part of this work was first
presented at the 29th International Symposium
on High Performance Liquid Phase Separations
and Related Techniques, Stockholm, Sweden,
June 2005.