For more than 30 years, 2-D electrophoresis has been
used by researchers around the globe to separate proteins
by charge and then by size. Two-dimensional electrophoresis has become a widely used technique
in the field of proteomics for the study of protein
expression and to identify proteins in complex mixtures.
Two-dimensional electrophoresis is the separation
of a protein sample by two different electrophoretic
methods. The current methodology consists
of isoelectric focusing (IEF) separation of proteins
in gel strips based on the proteins’ isoelectric point
(pI) under denaturing and reduced conditions (first
dimension) followed by separation in a slab gel based
on protein mass (second dimension). The combined
technique resolves proteins into spots. Proteins are
detected either by prelabeling the proteins or by
staining the gel post electrophoresis. The gels are
imaged and quantified to look for differences in the
resulting 2-D patterns, or the individual protein spots
can be excised from the gel and identified using mass spectrometry or amino acid sequencing.
Improvements in the IEF gel matrix using immobilized
pH gradients (IPG) have led to more stable and
more reproducible pI separations for the first dimension.
The first-dimension separation is performed in
ultrathin, low-percentage acrylamide gels that are
cast onto a polyester backing for easier handling.
The gels are cast as gradient gels with a pH gradient
being formed by the use of acrylamido buffers, such
as Immobilines® (GE Healthcare, Piscataway, NJ),
covalently bound within the acrylamide matrix. The
gels are shipped dry and need to be hydrated with
buffers, sometimes including the sample, before use.
Each strip is used to separate one protein sample.
Voltage must be applied to the hydrated gel strip and
the separation occurs for a recommended number of
volt-hours (Vhrs). In the past, this was determined
simply by multiplying the voltage by the number of
hours that voltage is applied. Today, most instruments
include a counter to record the voltage over
time and calculate the accumulated Vhrs.
Originally, separations of proteins using IPG
strips were carried out on flat-bed systems.
External power supplies were used to apply voltages
up to 5000 V, and separation temperature
was provided and controlled by external chiller
units. In the 1990s, instruments were introduced
to combine and consolidate the power
supply and cooling into a single, integrated
unit; these units allowed for higher voltages up
to 10,000 V. Little has changed in instrument
design over the past 10 years. A recent development,
however, the Hoefer IEF100 isoelectric
focusing unit (Hoefer Inc., Holliston, MA)
(Figure 1), provides a number of features and
enhancements, including higher voltage for
sharper focusing, constant wattage control to
help reduce heat generation, simplified programming
for ease of use, individual strip monitoring
for documentation of the IEF separation,
enhanced temperature control, and a graphical
user interface for quick visual display of the
voltage profile and current generated on each
sample strip. The key benefits are better feedback
on individual sample performance, visual
display of each strip’s data profile, and faster
run times for IPG strips that require many total
Vhrs to focus.
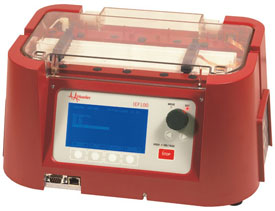
Figure 1 - Hoefer IEF100 isoelectric focusing unit.
The instrument used for the first-dimension
IEF must be capable of high voltages for high
resolution of proteins. Based on the formulas of
Rilbe in 1973, the resolution of IEF is dependent
on the square root of the electrical field.1,2 The
higher the field strength applied, the higher the
resolution. The Hoefer IEF100 offers 12,000-V
output, the highest voltage available from any
commercial product. In addition, each IPG strip
manufacturer offers suggestions for the number
of Vhrs required for good focusing within its IPG
strip. The total Vhrs required varies depending
on the pH range and the length of the IPG strip.
Volt-hour focusing values of 100,000 Vhrs are
not uncommon, and newer IEF instruments utilize
very high voltages to speed focusing times.
During the final focusing steps of the IEF separation,
a higher voltage applied will accumulate
the required Vhrs in a shorter time period, something
easily accomplished with the Hoefer IEF100.
The first step in generating high-quality 2-D results
is good sample preparation. Under native conditions,
proteins may have limited solubility. To maximize
the solubility of a protein mixture, chaotropes such
as urea and thiourea, and nonionic detergents such
as Triton X-100 (The Dow Chemical Co., Midland,
MI) or zwitterionic detergents such as CHAPS
(3-[(3-cholamidopropyl)dimethylammonio]-1-propanesulfonate))
are used during IPG strip hydration
and during sample preparation. Reductants are also
added to reduce the disulfide bonds and unfold the
proteins. Some care must be taken in sample preparation
to reduce the quantity of compounds that
contribute charge or conductivity to the IPG strip
matrix. Samples that contain high concentrations
of salts have higher conductivity and may prevent
the strips from reaching their desired maximum voltages.
This higher conductivity slows down the focusing
times and can lead to the strips burning if not
carefully controlled by the limits of the IEF device.
Typically, low power is used at the beginning of the
run with increasing voltage applied over time. This
can help by slowly migrating samples to their pIs,
minimizing the heat generated at the beginning of
the run, followed by a high-voltage phase to drive
the proteins into sharp pI zones. Fully programmable
instruments such as the Hoefer IEF100 allow multiple
steps to be programmed to gradually increase the
applied voltage over time for increased flexibility.
Programmability enables the unit to change between
phases without user intervention and reduces the
risk of burning the strips.
The Hoefer IEF100 permits control of power to the
IPG strip by setting a constant wattage for some or
all of the steps of a given protocol. This helps to control
the current and voltage applied to the sample
and prevents overheating. For example, in a simplified
two-step protocol, a low wattage step is used to
initiate salt and protein migration. As proteins and
ions focus into zones, ion movement slows down,
and the conductivity of the strip decreases. As the
current decreases, higher voltages can be applied to
the strips. By controlling the wattage, the heat generated
during electrophoresis is also controlled.
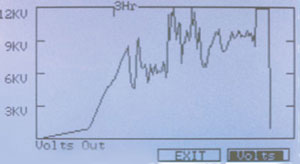
Figure 2 - Hoefer IEF100 graphical display of the total
voltage applied to the IPG strips.
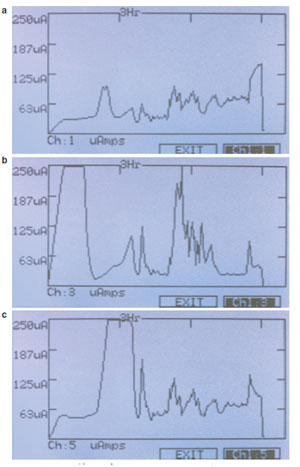
Figure 3 - a) Hoefer IEF100 graphical display μA current generated
of sample extract. b) Hoefer IEF100 graphical display μA current
generated of sample extract including 25 mM NaCl (salt). Note the high
current at the beginning of the run and spikes later in the run as the strip
begins to burn. c) Hoefer IEF100 graphical display μA current generated
of sample extract including 50 mM Tris. Note the higher current later in
the run as the voltage is increased. Overall these strips have higher conductivity
than those without Tris.
The Hoefer IEF100 has the ability to monitor each
individual IPG strip and show both numerically and
graphically the individual current of each strip. The
usefulness of this feature is shown in the examples
of the graphical display and resulting 2-D gels for three IPG strips separated in the Hoefer IEF100
focusing unit. Figure 2 shows the total voltage
applied to all the strips being focused. Figures
3a–c display the current generated in three IPG
strips. Figure 3a shows the current profile of a
24-cm, 3-10NL (nonlinear pH gradient) IPG
strip with ~37 mg Escherichia coli extract in standard
8 M urea, 2% CHAPS, 0.05% Pharmalyte
buffer (GE Healthcare). Figure 3b is an identical
strip, but with 25 mM salt (sodium chloride)
included in the buffer. Figure 3c is an identical
strip, but with 50 mM Tris included in the buffer.
It is apparent even before completing the
experiment that the conductivity of each strip
is very different. The strips with no additives
give a fairly flat and even current throughout
the run, but strips containing salt and Tris have
large peaks of high current as the run progresses.
By looking at the data and comparing them to
the graphs of other strips or previous runs, the
user may gain insight into sample properties
that can lead to problematic results.
Following focusing, the strips were equilibrated
in 50 mM Tris-Cl pH 8.8, 6 M urea, 30% glycerol,
2% sodium dodecyl sulfate (SDS), and 1%
dithiothreitol, and overlaid onto 12.5% SDS slab
gels. The SDS gels were run in the Hoefer SE900
2nd Dimension Gel system (Hoefer Inc.) for
30 min at 100 V followed by 6 hr at 80 mA per
gel. The gels were silver stained. The gel images
(Figures 4–6) help to demonstrate the problems
of how these ionic compounds interfere with the
final 2-D results. Conventionally, 2-D images are
displayed with the acidic region to the left and
the basic pI region to the right. The SDS second
dimension separated the samples from the top
(highest molecular weight) down to the bottom
(lowest molecular weight).With the addition
of salt (Figure 5), there is a large blank region
toward the basic end (right side) of the 2-D gel
and streaking resulting from the concentration of
proteins just before this salt effect. The addition
of Tris (Figure 6) led to poorly focused spots and
increased horizontal streaking. The user now can
see through the graphical interface that the strips
had variations in their conductive properties,
and can then decide if the run properties need
to be altered to avoid damage to the strip, if the
strip needs to be removed from the focusing run,
or if the sample should be prepared differently in
future sample preparations.
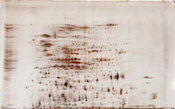
Figure 4 - Silver stain of a 2-D gel result generated using a 24-cm,
3-10NL pH IPG strip with ~37 mg E. coli extract in standard 8 M
urea, 2% CHAPS, 0.05% Pharmalyte buffer.
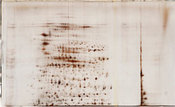
Figure 5 - Silver stain of a 2-D gel result generated using a 24-cm,
3-10NL pH IPG strip with ~37 mg E. coli extract in standard 8 M
urea, 2% CHAPS, 0.05% Pharmalyte buffer containing 25 mM NaCl.
Note the blank region on the right (basic) end of the IPG strip where salt
interferes with the 2-D pattern. The location of strip burning is also evident
by the yellow streak running vertically down the gel.
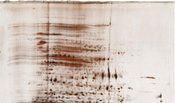
Figure 6 - Silver stain of a 2-D gel result generated using a 24-cm,
3-10NL pH IPG strip with ~37 mg E. coli extract in standard 8 M
urea, 2% CHAPS, 0.05% Pharmalyte buffer containing 50 mM Tris.
Note the poor focusing of sample particularly in the acidic (left) side of
the 2-D gel.
Capturing the IPG strip current information in
real time provides feedback to users, enabling
greater control of the separation and therefore
allowing them to make better decisions with
respect to problematic or highly conductive samples.
These highly conductive samples may limit the
maximum voltage or current available for the entire
run. As described by Görg,3 low voltages for extended
periods of time at the beginning of the run can help
to desalt the sample prior to IEF separation. When a
strip is noted as having very high conductivity at the
beginning of the run, the user can modify the protocol
to include a low-voltage desalting phase or remove
the strip from the experiment since the higher conductivity
may limit run parameters. Without proper
salt removal, strips can dry out and burn (see Figure
7). The Hoefer IEF100 can display the erratic behavior
of a burning IPG strip (as shown in Figures 2 and
3b). The ability to monitor each IPG strip individually
provides immediate feedback to the researcher.
This valuable information can be used to advise the
researcher to modify sample preparation or run parameters
and prevent run failure.
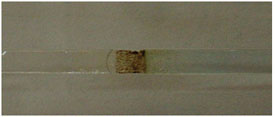
Figure 7 - Results of too high a voltage applied to 24-cm
strip containing 25 mM salt. The IPG strip has begun to burn
as can be seen by discoloration and damage to the IPG gel. The
Hoefer IEF100’s graphical interface shows erratic currents as
the conductivity across the damaged area changes and arcing
occurs (Figure 3b).
In some cases, other ionic compounds such as
Tris are included in sample extraction buffers or
added to adjust the pH of the sample preparation.
Smejkal4
notes that these ions can create boundaries
that proteins cannot traverse, restricting them
from achieving true focusing. In the examples
provided with Tris (Figure 3c), the current profile is higher and flatter than the sample without
Tris. In addition, the gel pattern shows disruption.
To avoid the complications of additives, sample
cleanup prior to IEF can be helpful to remove
ionic compounds.
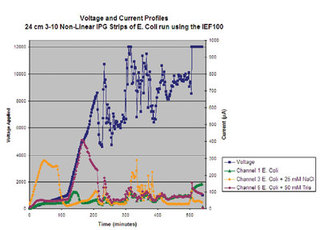
Figure 8 - Chart of parameters recorded during an IEF run using the
Hoefer IEF100. Along the left y axis, the voltage delivered is plotted over
time (x axis). Using the second y axis, the current of the individual IPG
strips is recorded over time. Note that the channel containing salt (Figure
3b, channel 3) has very high conductivity (shown by the very high μA) at
the start of the run, which eventually decreases as the salts and proteins
migrate in the IPG strip. Though this graph shows the parameters for
three of the six channels, the Hoefer IEF100 will record the parameters
for each of the six focusing channels in addition to the Vhrs, W, and temperature
of the run.
In addition to displaying the voltage and current
profile (data) on the liquid crystal display
(LCD) of the Hoefer IEF100, all run parameters
can be sent to an external printer or
captured to a computer (Figure 8). Importing
the data into a spreadsheet program such as
Microsoft® Excel™ can allow users to generate
a graph of all parameters for the run. Thus
they are able to keep a permanent record of
the set parameters and run conditions and
diagnose any problems that may arise during
the focusing.
Temperature control is also very important in
order to achieve reproducible results and prevent
any hot spots from occurring. A protein’s
pI is dependent on the temperature of the separation.
A separation at 20 °C might be very
different from one at 25 °C. Under denaturing
conditions, temperatures over 37 °C may be
detrimental to the protein separation. Heating
of samples in urea solutions can carbamylate
proteins and introduce charge changes,
which is undesirable when protein separation
is based on charge. Localized hot spots can be
generated in zones of high conductivity, such
as areas containing high ion concentration.
Fast dissipation of this heat is important to prevent
overheating in localized regions. The Hoefer
IEF100 is equipped with a Peltier-cooled focusing
bed to accurately and precisely control the temperature
of the separation.
Conclusion
By controlling the temperature, delivering very high
voltages, and collecting data on each individual sample,
the Hoefer IEF100 is an invaluable tool for the
proteomics researcher.
References
- Andrews, A.T. Electrophoresis, 2nd ed.; Oxford University Press: Oxford, U.K., 1986; pp 247–50.
- Righetti, P.G. Immobilized pH Gradients: Theory and Methodology; Elsevier Science Publishers: Amsterdam, The Netherlands, 1990; pp 108–11, 120.
- Görg, A.; Obermaier, C.; Boguth, G.; Harder, A.; Scheibe, B.; Wildgruber, R.; Weiss, W. The current state of two-dimensional electrophoresis with immobilized pH gradients. Electrophoresis Apr 2000, 21(6), 1037–53.
- Smejkal, G.; Robinson, M. Tris interference in IEF and 2-DE. Electrophoresis May 2007, 28(10), 1601–6.
Ms. Laird is Senior Scientist, Hoefer Inc., Holliston, MA,
U.S.A. Mr. Cohen is President, and Mr. Attwood is Director
of Sales and Marketing, Harvard Bioscience, Electrophoresis
Business, 84 October Hill Rd., Holliston, MA
01746, U.S.A.; tel.: 508-893-8999; fax: 508-429-5732;
e-mail: [email protected].