Detection of low levels of biomarkers utilizing enzyme linked immunosorbent assay (ELISA) technology is demonstrated through the use of Raman scattering techniques and a convertible substrate for horseradish peroxidase (HRPO). This paper describes the use of a Raman detection system with commonly used sandwich ELISA assays utilizing a 96-well microtiter plate bound capture antibody. The Sword Raman detection system from Sword Diagnostics (Chicago, IL) replaces typical ELISA detection moieties (absorbance, fluorescence, and/or chemiluminescence-based HRPO substrates) with a substrate upon which HRPO oxidation generates a large Raman signal.1 The reaction chemistry is compatible with typical ELISA reagents and does not require the reconfiguration of standard ELISA assays (new biotinylated probes and/or conjugates are not required).
After stopping this end-point reaction, the Raman signal is measured using the fluorescence detection channel of commercially available microtiter plate readers, and is treated similarly to the way in which absorbance, fluorescence, and/or luminescence data are processed. The Infinite® line of multimode readers (monochromator-based M1000 or M200 models and filter-based F500 or M200 models) from Tecan (Männedorf, Switzerland) are typically used in the Sword Diagnostics laboratories. This application of Raman spectroscopy is novel since Raman is typically used for structural identification of specific organic and inorganic substances,2 and has not, until now, been used as a quantitative biochemical detection tool.1,3
Data collection and analysis
In these studies, the M1000 multimode reader was used to collect the data. The experimental results were loaded automatically by Tecan i-Control® software to Microsoft Excel® for further analysis. Dose response curves were fitted to a four-parameter logistic curve (4PLC) using the equation communicated by Rodbard4:
where X = assay response, Y = concentration; and A, B, C, and D = equation parameters.
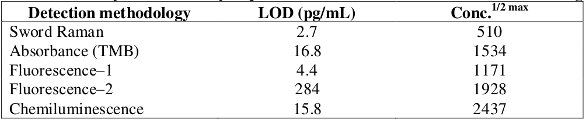
The analytical limit of detection (LOD) was defined as the concentration read from the fitted 4PLC at a response level equal to the mean negative control level plus two times the standard deviation estimated from the negative control population. The standard concentration read from the fitted 4PLC at a response level equal to one-half the response of the highest calibrator run was also determined. This value (conc.1/2 max) was used as a metric to describe the observed “leftward shift” of the Sword peroxidase reagent dose response curve. This value is related to the shift of the curve: the lower this value, the greater the shift of the curve.
Sword Raman detection versus absorbance, fluorescence, and chemiluminescence detection
The performance of this detection methodology using free peroxidase was compared to commonly used absorbance, fluorescence, and chemiluminescence detection methodologies. The mean response values from each assay system were plotted against the HRPO standard concentrations on semi-log plots. The data were then fitted to a 4PLC. These fitted curves were added to the plots to demonstrate the relative fit of the observed data to the fitted curve, as demonstrated in Figure 1. The results from each detection methodology evaluated (Sword Raman substrate, TMB as a representative absorbance substrate, two separate fluorescence substrates, and a chemiluminescence substrate) were plotted on the same plot, scaling the response axis (Y axis) such that the negative control (0 pg/mL) and the highest positive (3000 pg/mL) values from each respective curve overlapped. The data obtained using each of the five detection reagents yielded smooth dose response curves that fit well to a 4PLC curve (with R2 values of more than 0.9996 for all 4PLC fits).5
 Figure 1 – Dose response curves of the Sword Raman, TMB, fluorescence, and chemiluminescence substrates using free peroxidase.
More importantly, the Sword peroxidase reagent-derived dose response curves were shifted to the left, relative to the absorbance, fluorescence, and chemiluminescence reagent-derived curves (Figure 1). The magnitude of this shift was described by evaluating the conc.1/2 max values (Table 1). This suggests that the Sword peroxidase reagents are capable of detecting lower concentrations (concentrations often of interest in assays) with sample noticeably improved from the negative control samples. The shifted curves also yielded an improvement in the observed analytical limit of detection (Table 1). This demonstrates that Sword Raman detection system is about 2–100 fold more sensitive than these commercially available substrates.1,5
Table 1 – Analytical sensitivity of peroxidase with different detection methodologies
ELISA evaluation procedure
Several ELISA assays were evaluated using the Sword technology. Each ELISA assay was run as indicated in the package insert instructions. When the Sword peroxidase reagents were evaluated, the final detection step (after the final conjugate incubation and appropriate washes) was modified by substituting the native detection reagents with the Sword peroxidase reagents. The Sword peroxidase substrates were incubated in the ELISA reaction wells for 15 min at room temperature, followed by the addition of Sword development solution. The Raman signal was measured using a M1000 multimode reader (as relative fluorescence units, RFU) after 30 min additional incubation at room temperature.3 The Sword peroxidase reagent signal was stable for up to 90 min after completion of the development step.
ELISA evaluation results
Sensitivity
Table 2 –Analytical sensitivity (LOD) of assays as measured with Sword peroxidase reagents
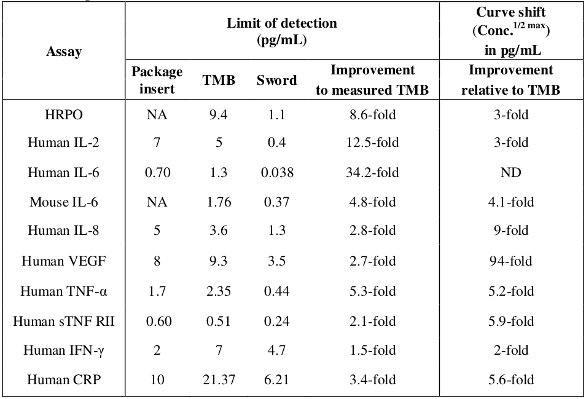
The assay analytical limit of detection and conc.1/2 max values from each assay evaluated are tabulated in Table 2. These results demonstrate that the Sword peroxidase reagents dose response curves were shifted leftward (toward lower analyte concentrations) compared to native substrates. This shift is indicative of an increased detection capability of low analyte samples with Sword peroxidase reagents relative to that observed with the native assays tested in this study. Dose response curves of human TNF-α and human IL-6 assays are shown in Figure 2 to illustrate these curve shifts.6–8
 Figure 2a– Comparison of Sword Raman detection to TMB detection in human IL-6 ELISA.
 Figure 2b – Comparison of Sword Raman detection to TMB detection in human TNF-α ELISA.
Sample volume reduction
The Sword peroxidase reagents’ leftward shift of the dose response curve indicates that more analyte-dependent signal (signal distinguishable from the background) is present when the Sword peroxidase reagents are employed. This aids assay developers in obtaining an acceptable balance between critical assay attributes such as sample volume, assay kinetics, sensitivity, specificity, and stability. Since improvements in one attribute often come at the expense of others (e.g., higher assay sensitivity at the expense of assay specificity, sample size, or kinetics), the more analyte-dependent signal that is available to use in attaining an acceptable balance, the better the final optimization results. This analyte-dependent signal is referred to as the “currency” that developers have to spend in their efforts to obtain the best balance of performance attributes.
To demonstrate the power of the increased optimization currency, a sample volume reduction study was run using a commercially available human TNF-α assay. In this study, the original sample size, 100 μL, was reduced to 50 μL and 25 μL. The dose response curves from the reduced sample volume runs were compared to that of the normal Sword peroxidase and TMB reagent runs (Figure 3). As the sample size was reduced, the analyte dose response was maintained over the entire range. However, the Sword peroxidase reagents’ leftward shift of these curves diminished with each volume reduction, each curve becoming more similar to the native TMB curve. This demonstrates how assay currency (leftward curve shift) was spent to achieve improvement in a critical performance attribute, such as reduced sample size.10
 Figure 3 – Comparison of the dose response curves with reduced sample volume to the normal Sword Raman and TMB runs.
Assay optimization
In many cases, introduction of the Sword peroxidase reagents into existing assays results in improved assay performance. However, to achieve the full benefits with these detection reagents, additional assay optimization is often required, even if an assay was fully optimized using its native detection system. A TMB-based mouse IL-6 assay was used to demonstrate the power of follow-up optimization. The assay was obtained in a format in which all critical components were supplied as reagent concentrates. This allowed the optimization of the capture antibody, biotinylated probe and HRPO conjugate concentrations, plate types, buffer/diluent formulations, and assay kinetics. In this effort, the researchers did not substitute or alternate the biological components (such as alternate antibodies, biotinylated probes, and HRPO conjugates).
During optimization, the impact of different reagent concentrations (via designed experimentation or DOE studies), different plate types, and assay incubation conditions on assay sensitivity were evaluated using the Sword peroxidase reagents. The final optimized assay used a different plate, coating conditions, and incubation conditions. This reoptimized assay yielded a 14–18 fold improvement in assay sensitivity (LOD), with a 6–8 fold improvement in the Sword peroxidase reagents’ sensitivity over that originally observed with the TMB detection system (Figure 4).10
 Figure 4 – Improvement of limit of detection (LOD) during optimization of mouse IL-6 ELISA.
During this optimization effort it was observed that in many cases changes in the assay procedure resulted in changes in the Sword peroxidase reagent-derived signal but not in the TMB-derived signal. This was especially true at the lower sample concentrations, where improved low-end signal detection was noted with the Sword peroxidase reagents but not with the TMB reagents. This differing response to assay conditions suggests that all previously optimized conditions (with the native substrate) should be reexamined when reoptimizing assays with Sword peroxidase reagents. It should be noted that each assay is different and may react differently to changes during optimization. The factors driving performance changes are often dependent upon the biological reagents/formulations used, the assay format, and the protocols adopted.
Conclusion
The detection system described in this article is based on the use of Raman detection in a peroxidase-based immunoassay system and could be easily incorporated into existing assays without modification to the assay format or use of a dedicated microplate reader. The detection reagents are robust, and no special environmental protection is required (as opposed to many commercially available detection reagents). The leftward shift in the dose response curves with these reagents often results in an immediate sensitivity improvement, which is beneficial for the detection of low-abundance biomarkers. Follow-up optimization often results in performance enhancement, as demonstrated with the mouse IL-6 assays. Similar follow-up optimization improvements have been observed using commercially available human TNF-α kits and the Sword peroxidase reagents (data not shown).
References
- Kundu, S.; Siegel, N. et al. Raman detection system for immunoassays: a sensitive Raman-scattering method for peroxidase based enzyme-linked immunoassays for peroxidase based enzyme-linked immunoassays. IVD Technology Mag., summer 2010.
- Nyquist, N.; Kagel, R.O. et al. Handbook of Infrared and Raman Spectra of Inorganic Compounds and Organic Salts; Academic Press: New York, NY, 1996; Vol 1–4.
- Sword Diagnostics Peroxidase Reagent Kit Insert. Sword Catalog N818.
- Rodbard, D. Statistical quality control and routine data processing for radioimmunoassay s and immunoradiometric assays. Clin. Chem. 1974 Oct; 20(10), 1255–70.
- Peroxidase Detection using Sword™ Diagnostics Peroxidase Reagents: Enhanced Performance using the Tecan Infinite™ M1000 multimode reader. Tecan Technical Note 396612 V 1.0, 10-2011 (Tecan Group Ltd., Sword Diagnostics).
- Human TNF-α ELISA using Sword™ Diagnostics Peroxidase Reagents: Enhanced Performance using the Tecan Infinite™ M1000 multimode reader. Tecan Technical Note 396610 V 1.0, 02-2011 (Tecan Group Ltd., Sword Diagnostics).
- High Sensitivity Human IL-6 ELISA with Expanded Dynamic Range ELISA using Sword™ Diagnostics Peroxidase Reagents: Enhanced Performance using the Tecan Infinite™ M1000 multimode reader. Sword Technical Note; www.sworddiagnostics.com.
- Human IL-6 chemiluminescent ELISA using Sword™ Diagnostics Peroxidase Reagents: Enhanced Performance using the Tecan Infinite™ M1000 multimode reader. Tecan Technical Note 396608 V 1.0, 02-2011 (Tecan Group Ltd., Sword Diagnostics).
- Human C-reactive protein ELISA using Sword™ Diagnostics Peroxidase Reagents: Enhanced: Performance using the Tecan Infinite™ M1000 multimode reader. Tecan Technical Note 396606 V 1.0, 02-2011 (Tecan Group Ltd., Sword Diagnostics).
- An Optimized Mouse IL-6 ELISA using B using Sword™ Diagnostics Peroxidase Reagents: Enhanced Performance using the Tecan Infinite™ M1000 multimode reader. Tecan Technical Note 396728 V 1.0, 10-02-2011 (Tecan Group Ltd., Sword Diagnostics).
Samar Kundu, Ph.D, D.Sc., is Senior Scientist; Charles Ginsburgh, Ph.D., is Senior Scientist; Sandra Lynch, MT (ASCP), is Senior Technologist; and Neal Siegel, Ph.D., is Chief Scientist, Sword Diagnostics, 3440 S. Dearborn St., Ste. 260, Chicago, IL 60616, U.S.A.; tel.: 312-636- 4784; fax: 312-235-3670; e-mail: [email protected].