Amino acids are critical biological components having multiple metabolic functions, particularly when linked together to form proteins, and have any number of important roles. Thus, amino acid analysis plays a key role in the accurate quantitation of proteins and peptides, used for determining both the total protein in biomedical samples and the quantity of purified proteins and peptides for biochemistry research. While traditional methods have proved useful in analyzing amino acids, time-consuming and costly derivatization steps are usually needed. The addition of these steps can also impact the quality of the analysis. The following discussion covers existing methods, and introduces a new process that eliminates the derivatization step while providing comparable results.
Traditional methods for quantifying amino acids
Analysis of amino acids and their hydrolysates is typically carried out using HPLC with pre- or post-column derivatization for improved analyte retention or sensitivity, respectively. If only primary amino acids are required, o-phthalaldehyde (OPA) pre-column derivatization is effective. However, if the analysis requires separation of both primary and secondary amino acids, other approaches must be used. These include pre-column derivatization using reagents such as AccQ-Tag (Waters, Milford, Mass.) or fluorenylmethyloxycarbonyl (FMOC), and post-column derivatization using Thioflour (Pickering Laboratories, Mountain View, Calif.).
Although these methods are well-understood and have been well-received, the ability to analyze underivatized amino acids provides the advantages of increased convenience, simplicity and repeatability, while still providing the desired sensitivity and separation speed. Eliminating the derivatization steps also reduces the possibility of side reactions, interferences from reagents and sample contamination or degradation.1
Experimental
An Altus HPLC system was used for the chromatographic separations, and included the solvent and sample module, integrated vacuum degasser/column oven and an MS detector (all from PerkinElmer Inc., Shelton, Conn.). Instrument control, analysis and data processing was performed using the Waters Empower 3 chromatography data software (CDS) platform.2 The chromatographic separation system combines the flexibility of quaternary solvent along with a flow-through, direct sampling needle injector, allowing low dispersion, high resolution, high sensitivity and improved throughput. The MS detector features a single, high-resolution quadrupole mass analyzer utilizing an electrospray ionization (ESI) source and is fully integrated into the CDS platform. This enables the user to set up a single method, covering chromatographic separation and MS conditions, together with comprehensive reporting capabilities that permit full traceability and data integrity.
Method parameters
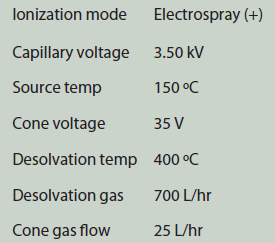
HPLC method parameters are shown in Table 1; Table 2 lists the MS and ionization method parameters.
Table 1 – HPLC method parameters
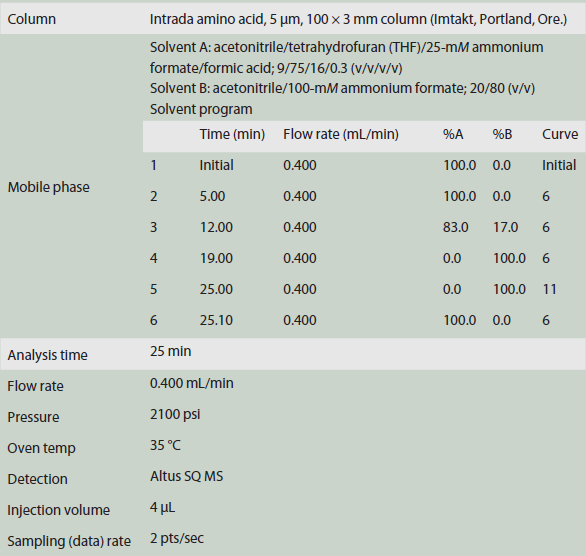
Table 2 – MS and ionization method parameters
Solvents, standards and samples
All solvents and diluents used were HPLC grade and filtered via 0.45-μm filters. The diluent was 0.1N HCl. The Pierce 17-Amino Acid Standard H Mix (protein hydrolysate) was obtained from Thermo Fisher Scientific (Rockford, Ill.). This included alanine (Ala), arginine (Arg), aspartic acid (Asp), cysteine (Cys), glutamic acid (Glu), glycine (Gly), histidine (His), isoleucine (Ile), leucine (Leu), lysine (Lys), methionine (Met), phenylalanine (Phe), proline (Pro), serine (Ser), threonine (Thr), tyrosine (Tyr) and valine (Val). The concentration for each amino acid was 2.50 μmol/mL in 0.1N HCl, except for cysteine, which was present at 1.25 μmol/ mL. The standard was diluted to 1.0 μmol/ mL for the working standard 1 (WS1) and to 0.1 μmol/mL for the working standard 2 (WS2). WS1 was used for the calibration of alanine and cysteine, because these two amino acids have lower sensitivity. The lower level standards were prepared from each of the two working standards via serial dilution with the diluent. Prior to injection, all calibration standards and samples were filtered through 0.45-μm filters to remove any small particles.
Results and discussion
Figure 1 shows the overlay of the selected ion recordings (SIRs) for all 17 amino acids, using the optimized conditions described above. The analysis time was under 25 minutes. Table 3 shows the retention times (RTs) and SIR windows/values used for each amino acid. An overlay of 10 replicates of 0.1 μmol/mL histidine standard is shown in Figure 2. A five-level calibration suite was used, covering a concentration range of 0.006 to 0.10 μmol/mL, except for alanine and cysteine, which covered a concentration range of 0.06 to 1.00 μmol/mL. Figure 3 shows the representative calibration data for aspartic acid, glycine, histidine and methionone. All amino acids followed a quadratic (2nd-order) fit.
 Figure 1 – Overlay of SIRs for 17 analytes: 1) Phe, 2) Tyr, 3) Leu, 4) Met, 5) Ile, 6) Val, 7) Glu, 8) Pro, 9) Thr, 10) Asp, 11) Ala, 12) Ser, 13) Gly, 14) Cys, 15) His, 16) Lys, 17) Arg.
Table 3 – RTs and SIR windows/values for the 17 analytes

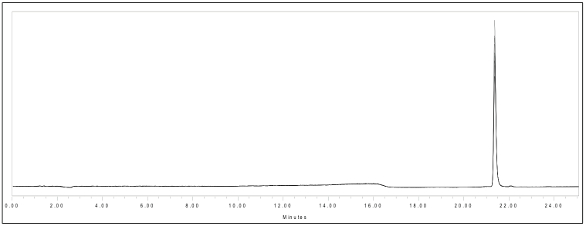 Figure 2 – Overlay of 10 replicates of 0.1 μmol/mL histidine standard.
 Figure 3 – Results of five-level calibration suite for aspartic acid, glycine, histidine and methionone (n = 3).
The R2 coefficients for the 17 amino acids are seen in Table 4, which demonstrates that all values exceeded 0.999 (n = 3 at each level).
Table 4 – Curve fit and LOD/LOQ results

As shown in Table 4, limit of detection (LOD) and limit of quantitation (LOQ) levels were established for each analyte, based on a signal-to-noise (S/N) of >3/1 for the LOD and >10/1 for the LOQ. The considerably higher values for alanine are due to its lower ionization efficiency.
Conclusion
Apart from the higher limit for alanine, which was due to its lower ionization efficiency, the LODs for all other analyzed amino acids ranged from 0.12 to 1.44 nmol/mL. Also, with the exception of alanine, all LOD/LOQ values were more than fivefold lower than historical values obtained for OPA-derivatized amino acids.3
This work demonstrates a simple, rapid and direct method using HPLC coupled with MS detection for the determination of amino acids, offering high sensitivity and selectivity without pre- or post-column derivatization.
In addition, the results demonstrate exceptional linearity and retention time repeatability over the tested concentration range.
References
- Agrafiotou, P.; Sotiropoulos, S. et al. Direct RP-HPLC determination of underivatized amino acids with online dual UV absorbance, fluorescence and electrochemical detection. J. Sep. Sci. 2009, 32, 949–54.
- www.perkinelmer.com/Content/EHApplicationNotes/012533_01%20The%20Analysis%20of%20Underivatized%20Amino%20Acids%20by%20HPLC%20with%20MS%20Detection.pdf
- Bartolomeo, M.P. Maisano, F. Validation of a reversed-phase HPLC method for quantitative amino acid analysis. J. Biomol. Tech. 2006, 17, 131–7.
Chi Man Ng, at the time this article was written, was a strategic applications specialist with PerkinElmer Inc. Wilhad M. Reuter is currently a strategic applications leader with PerkinElmer, 710 Bridgeport Ave., Shelton, Conn. 06484, U.S.A.; tel.: 203-925-4602; e-mail: [email protected]; www.perkinelmer.com