Due to the growing interest in the comparative analysis of biological samples in the fields of biomarker discovery and metabolomics, the complexity of samples faced by researchers is greater than ever. Biomarker discovery is focused on the discovery of large biological molecules, proteins, and peptides, which could be used to diagnose the presence or risk of disease, or to match treatments to a specific individual and his or her specific form of disease. Metabolomics is focused on the small-molecule metabolites found within an organism and provides a new, unbiased approach to understanding metabolic pathways.
In the past, researchers identified these molecules based on lengthy serial studies of metabolic pathways and disease mechanisms. Advances in accurate- mass time-of-flight (TOF) and quadrupole time-of-flight (Q-TOF) liquid chromatography-mass spectrometry (LC-MS) are helping researchers to use new, highly parallel screening and profiling approaches to manage and reduce sample complexity.
This article uses application examples in proteomics and metabolomics profiling to describe the utility of TOF and Q-TOF design innovations that provide 1–2 ppm MS mass accuracy, 2–4 ppm MS-MS mass accuracy, five decades of dynamic range, and attomole to low-femtomole sensitivity. Software tools to speed processing of complex data and the production of statistically meaningful answers, including molecular feature extraction, database searching, and molecular formula generation software, are examined in the context of the application examples.
Sample complexity
Due to post-translational modifications, proteins are highly diverse. It is estimated that there are 250,000–500,000 proteins in human cells, and only a small number of these have been identified. Analytical complexity grows when proteins are enzymatically digested into 20 or more peptide fragments to facilitate separation and detection. Extensive fractionation of complex samples may be necessary to identify more of the proteins, greatly increasing the number of analyses required. Metabolites, smaller molecules, exhibit even greater chemical diversity; their chemical structures differ greatly and are often not related. Like proteins, many have not been identified and characterized. To add to the analytical challenge, the concentration of proteins and metabolites found in biological samples can vary by many orders of magnitude. Compounds present at the lowest levels are often of greatest interest.

Figure 1 - Comparative analysis work flow.
Comparative analysis work flow
Proteomics and metabolomics analyses can be simplified using a new mass profiling approach to determine statistical differences between similar sample sets (Figure 1). In a mass-profiling experiment, the sample sets are analyzed by MS coupled to a separation method, and complex sets of molecular features are generated. A molecular feature is defined by the combination of retention time, accurate mass, and abundance. Advanced statistical analysis is used to compare and find significant differences in the molecular features between the sample sets. Because these studies involve large numbers of samples and complex data processing and statistical analysis, powerful informatics capabilities are essential. Molecular ions produced by accurate-mass TOF instruments can be used to generate possible molecular formulas or to search a database. Database matches to known compounds can be confirmed by use of a standard for comparison to the original sample for identity confirmation. For unknowns, the next step is often targeted LC-MS-MS analysis by accurate-mass Q-TOF LC-MS to generate spectral information to aid in identification.
Due to the tremendous complexity of these analyses and the data produced, the desirable traits of a TOF and Q-TOF LC-MS system include:
- Great separating power to resolve the large numbers of compounds in complex biological samples
- Near universal detection to analyze a range of molecular species
- Wide dynamic range to find low-abundance components in complex mixtures
- High sensitivity to detect low-level components
- High mass accuracy to reduce the number of possible identities
- Reproducibility of both retention times and mass data to reduce analytical variability
- Powerful software tools to process complex data and produce statistically meaningful answers.
Biomarker discovery—feature extraction
For this “model” biomarker discovery experiment, Escherichia coli (E. coli) lysate was used as a model to represent a complex sample. Equivalent amounts of lysate were spiked with varying amounts of bovine proteins, bovine serum albumin (BSA), and serotransferrin, for detection using the mass-profiling approach. The experiments were performed on an Agilent 1200 Series HPLC-Chip/MS system interfaced to an Agilent 6210 TOF MS (Agilent Technologies, Wilmington, DE). Accurate-mass TOF LC-MS data were extracted and evaluated using Agilent MassHunter molecular feature extraction software.

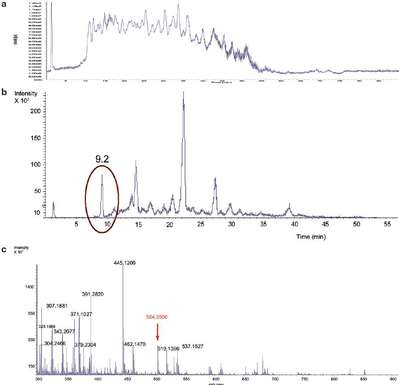
Figure 2 - TOF LC-MS results show the complexity of an E. coli lysate sample. a) Total ion chromatogram (TIC), E. coli lysate. b) Extracted ion chromatogram (EIC) for m/z 504.2507 ±1.9 ppm. c) Mass spectrum at 9.2 min.
Figure 2 shows the complexity of the samples. Even creating an extracted ion chromatogram (EIC) for the peptide at m/z 504.2507, using a narrow mass range of ±1.9 ppm, does not result in a single peak (Figure 2b). The mass spectrum for the peak at 9.2 min shows that the low-abundance peptide ion would likely not be selected for MS-MS identification using traditional approaches because there are many other more abundant ions (Figure 2c).

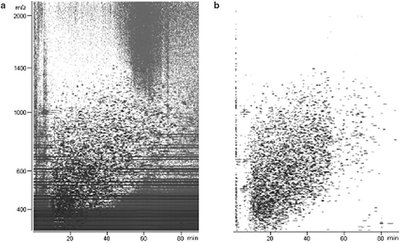
Figure 3 - Plots for an E. coli lysate sample show the usefulness of molecular feature extraction. a) Data before feature extraction. b) Data after feature extraction.
The challenge of mass profiling is finding all of the individual components, the molecular features, in complex data such as those shown in Figure 2. This is challenging because the complexity of the biological mixtures analyzed results in coeluting peaks regardless of the quality of the separation. It produces thousands of data points for the software to process (Figure 3). Powerful molecular feature extraction (MFE) software that locates individual sample components, including low-level components, in complex chromatograms is needed. To generate data useful for subsequent statistical analysis, the molecular feature extraction software must find the molecular features in each total ion chromatogram, remove background noise and unrelated ions, create reconstructed spectra, and create a molecular feature list, all very quickly and easily.
The common approach is to locate and combine data from covariant ions. The molecular feature extraction algorithm in MassHunter workstation software goes further. Tailored for accurate-mass TOF and Q-TOF data, the algorithm considers isotopic distribution and possible chemical relationships, such as sodium adducts and dimers, when determining whether different ions are from the same compound, and then it combines the mass signals from related ions. The result is more compounds found in complex samples and more meaningful results from the subsequent statistical analysis. The algorithm can do in seconds what would take weeks or months of manual analysis.
Figure 3 shows the experimental data before (a) and after (b) feature extraction using MassHunter software. Noise, shown as the streaks in the Figure 3a contour plot, is effectively removed. How well the feature extraction software works is highly dependent on the accuracy of the MS data.