Human genetics has benefited in the last decade
from spectacular technological advances in DNA
analysis. The rate of data acquisition has increased
by orders of magnitude. To cope with this flood of
information, semiautomated methods have been
developed for primary data collection and interpretation
of genotyping and direct DNA sequencing.
Here the authors examine several improvements in
experimental design and analysis, expediting disease
gene discovery in family-based genetic studies.
Microsatellite markers, also known as short tandem
repeats (STRs), arise from consecutive repeat units
such as CACACA . . . or GATAGATAGATA . . .
embedded within unique sequences.1 The human
genome contains many thousands of such repeats
of di-, tri-, and tetranucleotide types.2 PCR primers
designed in the surrounding unique sequence allow
unambiguous amplification of particular microsatellites.
Many of these sites are polymorphic within the
human population, segregating multiple alleles with
different repeat lengths. These PCR amplicons can
serve as genetic markers for the corresponding chromosomal
segments as they segregate through families.
Microsatellite marker length is normally conserved
over several meiotic generations, making these effective
tools for pedigree-based linkage analysis.3
Microsatellites offer several technical challenges.4 PCR enzymes tend to stutter at the repeats, leading
to a series of smaller-than-full-length peaks whose
lengths usually differ by one repeat unit.5 More
serious is the tendency of these enzymes to add an
additional, nontemplated nucleotide at the 3′ end
of the product. When the extent of such addition
is variable, this leads to the phenomenon of peak
splitting, which can render dinucleotide markers
practically useless. One way to reduce variability
in peak splitting is to add a specific sequence tag at
the 5′ end of one of the PCR amplification primers.
When fluorescent genotyping is being performed,
this should be the nonlabeled primer (often though
not always formalized as the reverse primer). Several
such sequence tags have been reported,6,7 although
their exact mechanism of action remains uncertain.
The authors have verified the effectiveness of such a
sequence tag, using either specialized plusA or nominally
standard PCR conditions. As shown in Figure 1a
and b, two different dinucleotide markers varied in the
sensitivity of splitting to the PCR protocol employed
when default primer design was used. However, addition
of the 5′ tag on the unlabeled primer minimized
variability for both markers, making genotype calling
less problematic in each case. This suggests that the
tag should routinely be included on all customized
microsatellite markers as a preventive measure.
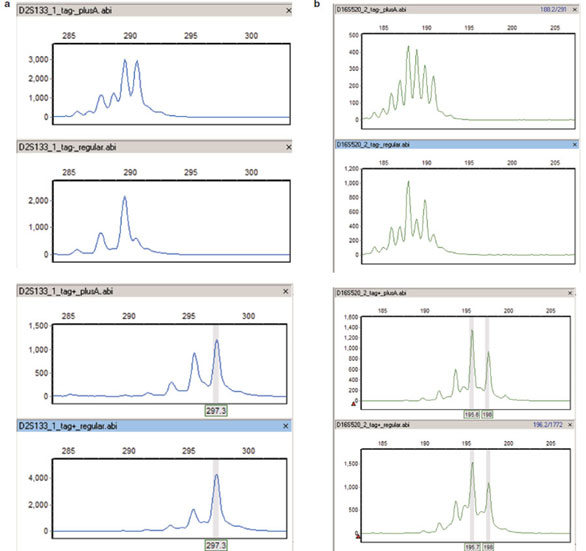
Figure 1 - Microsatellite genotyping before/after reverse 5′ sequence tag. a) Fluorescent primers for D2S133 were used to amplify
DNA from one randomly selected sample, which is homozygous for a particular allele of this marker. Amplification was performed
under two different PCR protocols, using either the tagged or untagged reverse primer. From top to bottom: minus tag, plusA PCR;
minus tag, standard PCR; plus tag, plusA PCR; plus tag, standard PCR. In the absence of the reverse tag, use of plusA PCR conditions
biases products toward nontemplated nucleotide addition, as seen by comparing the first and second panels. The addition of the reverse
tag increases amplicon size, as shown in the two bottom panels, and reduces variability in peak splitting under different PCR conditions.
Note that the stutter peaks at 2-bp intervals are independent of PCR conditions and presence of reverse tag. GeneMarker genotyping
software was used to identify and call the allele as 297 bp in the bottom panels (gray vertical bar). b) D16S520, from top to bottom:
minus tag, plusA PCR; minus tag, standard PCR; plus tag, plusA PCR; plus tag, standard PCR. Similar to panel (a), but this marker
is heterozygous for alleles at 196 and 198 bp, as called by GeneMarker (gray vertical bars) for the reverse tagged version of the marker.
Peak splitting is much more severe for this marker, but addition of the reverse tag still reduces the variation significantly. As above, addition
of the reverse tag increases the size of the amplicon.
SNP genotyping
Single-nucleotide polymorphisms (SNPs) provide
an alternative to microsatellites for genetic
mapping. Individual SNPs are overwhelmingly
biallelic, hence intrinsically less informative
than microsatellites. However, multiple SNPs
analyzed in tandem have the potential to carry
the same or greater information content than
microsatellites. Several millions of SNPs have
been genotyped as part of the HapMap project,
providing allele frequencies in several different
populations.8 High-density SNP panels are now
commercially available. When used appropriately,
these panels can be used for genetic mapping
of monogenic disorders in the traditional
family-based paradigm.
To compare the effectiveness of dense SNP panels
to microsatellite markers for pedigree-based genetic
mapping, the authors sought to verify a known
genetic linkage, using a large Nova Scotia Acadian
family segregating the recessive trait Niemann-Pick
type D.9,10 The underlying causal gene was identified
as NPC1 (OMIM #257220) by positional cloning,
11 and homozygous mutations in NPC1 were
confirmed in affected individuals in the Nova Scotia
kindred.12 The authors genotyped two distantly
related affected individuals plus one unaffected sibling
from this family (see Figure 2) using the Xba
50K chip (Affymetrix,
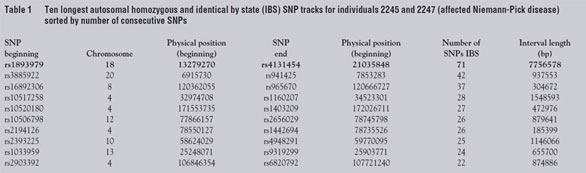
Santa Clara, CA). As seen in Table 1, the longest stretch of SNPs with shared
homozygosity for the same allele in the two affecteds
was approx. 7.7 Mbp on chromosome 18, including
71 consecutive SNPs around the NPC1 locus located
at position 19.4 Mbp. Unaffected sibling 2244 was
discordant (either heterozygous or else homozygous
for the other SNP allele) for 30 of these markers distributed
across the interval (data not shown). Thus,
the SNP chip successfully replicated the linkage in
this subset of samples from the entire pedigree with
substantial savings in time, labor, and cost.
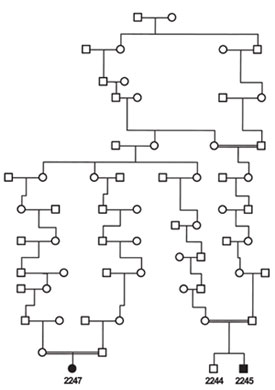
Figure 2 - Niemann-Pick type D (now called type C) pedigree. Individuals
2245 and 2247 (affected) and 2244 (unaffected) were genotyped
using the Xba 50K SNP chip (pedigree simplified from Greer et al.10).
Subtle discrepancies between absolute length and
number of consecutive SNPs across multiple chromosomal
regions led the authors to examine the
distribution of the entire 116,000 marker set, including
both the Xba and Hind chips. The distribution
of gap length is bimodal, with peaks at approx. 400
and 22,000 bp. Excluding the centromeres, there
are three gaps between 2 and 3 Mbp in length and
33 gaps between 1 and 2 Mbp in length. Some of
these gaps are telomeric, and some are relatively
gene-poor, but others are in gene-dense regions
presumably lacking appropriate restriction sites
near informative SNPs. The number of gaps in
the 1–3 Mbp range suggests that caution should
be used in interpreting high-density linkage disequilibrium
(LD) experiments. The newest generation
of ultrahigh-density 500K SNP panels
are now becoming available and these may be
preferable for some experimental designs.
Mutation detection
The final step in a gene discovery experiment
is mutation detection. Despite the use of indirect
physicochemical detection methods such as
denaturing HPLC (dHPLC), DNA sequencing
still provides the gold standard for sequence variant
(i.e., mutation) detection. Manual review
of large amounts of sequence data is inefficient
and at risk for missing mutations through human
error. Thus, several semiautomated methods
have been developed to serve this growing need
in molecular genetic analysis.13–17
The authors evaluated Mutation Surveyor (MutSurv, SoftGenetics, Inc., State College, PA)
for sequence variant detection, validating the
software using several samples containing known
variants including single base changes and insertion/deletions. The software aligns and compares
sample traces to reference or virtual consensus
sequence traces and performs the detection algorithm,
reporting potential mutations/polymorphisms
with quality scores, difference chromatograms,
and graphic outputs. The software imports
and utilizes genomic annotation if provided,
including location of exons and introns, open reading
frames, and known variants.
The software detected all previously identified variants
in the samples tested (Figure3a and b). In the
case of single-nucleotide variants, the software
flagged the mutation and conveniently interpreted
the expected effect on the protein coding potential
for the gene. In several cases, MutSurv has identified
known SNPs annotated in dbSNP. The graphic
alignment along the exons in the software made it
very simple to identify these known SNPs by comparison
to the UCSC (University of California,
Santa Cruz) genome browser interface. In the case
of insertion/deletions, it not only detected several
different mutations automatically, but also deconvoluted
them and correctly described the exact
sequence inserted or deleted (Figure 3c). All of these
results were verified by manual review.
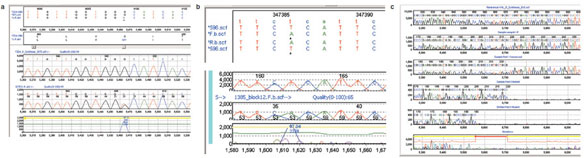
Figure 3 - Mutation detection with Mutation Surveyor. a) Automated detection of heterozygous missense SNP within FZD4 gene. Sequence chromatograms from potentially affected patients were aligned
to a virtual consensus trace created by Mutation Surveyor, and the mutation detection algorithm was run using default parameters. Top panel displays the nucleotide sequences of the virtual reference (ZD4.gbk) and patient samples. Conceptual translation sequence is given for the reference and for sample 372Ec-R with heterozygous missense variant predicted. Middle panels show chromatogram traces for virtual
reference sequence and sample 372Ec-R showing heterozygous missense change. Bottom panel shows difference trace between reference and missense change. b) Automated detection of homozygous SNP during
positional cloning. As in panel a, Mutation Surveyor output showing alignment of virtual reference sequence of a candidate gene (anonymized) to sequence of an affected patient. Lower panels show chromatograms
and difference trace at site of homozygous single-nucleotide change. c) Automated detection and deconvolution of 15-bp deletion in von Hippel-Lindau (VHL) Syndrome gene in affected patient. Mutation
Surveyor output showing virtual reference trace, affected patient trace, inferred component traces of heterozygous deletion, and position of deletion within annotated coding exon.
MutSurv flagged several false positives resulting from
poor-quality sequence, particularly near the ends of reads. New versions of the software allow for end trimming,
which should reduce the extent of this problem.
The incidence of false positives in low-quality sequence
can also be reduced by requiring mutation detection in
both directions, although acquiring sequence in both
directions can be problematic with some amplicons.
New genetic initiatives
The authors have recently embarked on a population-wide
genetic discovery effort to ascertain and molecularly
characterize many monogenic human disorders
in Eastern Canadian provinces (Figure 4). Such an
effort requires the increased efficiencies possible with
the technologies described here. Future improvements
are likely to include even higher-density
SNP chips;
reduced costs for SNP chips; lower DNA sequencing
costs; and ultimately cost-effective whole-genome or
whole-exon resequencing of individual probands.
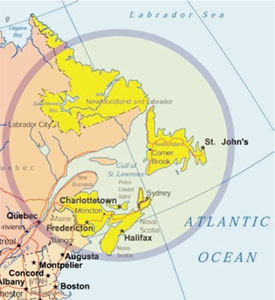
Figure 4 - The four Atlantic Canadian provinces of New
Brunswick, Newfoundland and Labrador, Nova Scotia, and
Prince Edward Island have a total population of approx. 2.3
million. The region contains numerous subpopulation isolates
defined by geography and/or ethnic heritage, with historically
large families and a few large tertiary-care medical referral centers.
These characteristics are optimal for ascertainment and
genetic characterization of monogenic disorders. As many as
15 new genetic conditions may arise in the region every year by
sporadic mutation; thus, the region provides a unique source of
genetic information for the Human Genome Project.
Methods
Samples
DNA was prepared from whole blood using standard
methods, or from saliva. Historically alternative
methods to venipuncture have included buccal
swabs and blood spots, but both of these methods
are variable and give very low yields. The Oragene
saliva kit (DNA Genotek, Inc., Ottowa, Ontario,
Canada) was tested. From collections on six different
individuals, genomic DNA yield varied from 20 to
320 μg per individual (for 2 mL of saliva collected).
Undigested DNA appeared to be high molecular
weight by agarose gel electrophoresis. The A260/A280
ratios (corrected for A320) ranged from 1.4 to 1.6,
and some samples appeared slightly turbid, possibly
due to residual carbohydrate or lipid components.
This ratio can be improved by slight modifications
to the protocol, including a 70% ethanol wash. All
samples worked well for microsatellite genotyping
and DNA sequencing with 10 ng input to PCR. The
authors have not systematically evaluated the DNA
for long-term storage or use in whole genome amplification,
but it should be noted that this protocol
has been validated by the manufacturer for use in
Affymetrix high-density SNP chip experiments after
repurification using Qiagen (Valencia, CA) kits.
Appropriate institutional ethics approval and
informed consent from patients were obtained for
use of all samples.
Microsatellite genotyping
Primers for annotated microsatellite markers
were taken from the GDB database. Custom fluorescent microsatellite markers were developed
from primary genomic sequence using Tandem
Repeat Finder18 in combination with the UCSC
genome browser,19,20 Repeat Masker,21,22 and
Primer3.23 Each amplicon was developed with
one labeled forward primer and paired unlabeled
reverse primers with or without a sequence tag
of 5′-GTTTCTT-3′ on the 5′ end. Two different PCR cycling conditions were tested. Nominal
“standard” conditions were: 95 °C 3 min (1 cycle);
95 °C 1 min, 55–60 °C 1 min, 72 °C 1 min (30
cycles); 72 °C 2 min (1 cycle). Specialized “plusA”
conditions were: 95 °C 5 min (1 cycle); 94 °C 15
sec, 55 °C 15 sec, 72 °C 30 sec (10 cycles); 89 °C
15 sec, 55 °C 15 sec, 72 °C 30 sec (20 cycles); 72
°C 30 min (1 cycle).7 Electrophoresis was on 6%
polyacrylamide gels using the ABI 377; chromatograms
were generated using ABI GenScan software
(ABI 377 and GenScan from Applied Biosystems,
Foster City, CA). Genotype chromatograms were
analyzed using GeneMarker (SoftGenetics, Inc.).
Genotype calls were exported in text format for
inheritance verification using PedCheck.24
SNP genotyping
Genotypes were collected for the Xba 50K SNP chip
at the Microarray Facility of the University of Toronto
Hospital for Sick Children (Canada). Genotype call
data were generated using Affymetrix software and
provided in spreadsheet format from the facility. Data
were collected on 58,960 SNPs, of which 58,494 had
unique locations in the human genome. Lengths
of homozygous SNP alleles identical by state were
derived by direct query of the database, and sorted
either by physical position or number of consecutive
homozygous IBS markers. Centromeric gaps lacking
sequence and marker information were deleted manually
for each chromosome.
Mutation detection
Fluorescent DNA sequencing trace files were
obtained following electrophoresis on the ABI 377.
Traces were imported into Mutation Surveyor and
analyzed for sequence variants. Genomic exon/intron and protein-coding annotation was provided
from the manufacturer’s database site or from the
National Center for Biotechnology Information
(NCBI). Synthetic wild-type reference sequence
traces were generated by the software from the consensus
genomic sequence.
On-line databases and tools
National Center for Biotechnology Information (NCBI)
Genome Home Page: http://www.ncbi.nlm.nih.gov/
UCSC Genome Home Page: http://genome.ucsc.edu
Online Mendelian Inheritance in Man (OMIM): http://www.ncbi.nlm.nih.gov/entrez/query.fcgi?db=OMIM
Genome Canada: http://www.genomecanada.ca/GCprogrammesRecherche
Repeat Masker: http://www.repeatmasker.org
Tandem Repeat Finder: http://tandem.bu.edu/trf/trf.html
Primer3: http://frodo.wi.mit.edu/
Applied Biosystems: http://www.appliedbiosystems.com
Affymetrix: http://www.affymetrix.com
SoftGenetics: http://www.softgenetics.com
GDB: http://www.gdb.org
References
- Weber, J.L. Human DNA polymorphisms and methods of analysis. Curr. Opin. Biotechnol.1990, 1, 166–71.
- Tamiya, G.; Shinya, M.; Imanishi, T.; Ikuta, T.; Makino, S.; Okamoto, K.; Furugaki, K.; Matsumoto, T.; Mano, S.; Ando, S.; Nozaki, Y.; Yukawa, W.; Nakashige, R.; Yamaguchi, D.; Ishibashi, H.; Yonekura, M.; Nakami, Y.; Takayama, S.; Endo, T.; Saruwatari, T.; Yagura, M.; Yoshikawa, Y.; Fujimoto, K.; Oka, A.; Chiku, S.; Linsen, S.E.; Giphart, M.J.; Kulski, J.K.; Fukazawa, T.; Hashimoto, H.; Kimura, M.; Hoshina, Y.; Suzuki, Y.; Hotta, T.; Mochida, J.; Minezaki, T.; Komai, K.; Shiozawa, S.; Taniguchi, A.; Yamanaka, H.; Kamatani, N.; Gojobori, T.; Bahram, S.; Inoko, H. Whole genome association study of rheumatoid arthritis using 27 039 microsatellites. Hum. Mol. Genet. 2005, 14, 2305–21.
- Ghosh, S.; Karanjawala, Z.E.; Hauser, E.R.; Ally, D.; Knapp, J.I.; Rayman, J.B.; Musick, A.; Tannenbaum, J.; Te, C.; Shapiro, S.; Eldridge, W.; Musick, T.; Martin, C.; Smith, J.R.; Carpten, J.D.; Brownstein, M.J.; Powell, J.I.; Whiten, R.; Chines, P.; Nylund, S.J.; Magnuson, V.L.; Boehnke, M.; Collins, F.S. Methods for precise sizing, automated binning of alleles, and reduction of error rates in large-scale genotyping using fluorescently labeled dinucleotide markers. FUSION (Finland–U.S. Investigation of NIDDM Genetics) Study Group. Genome Res. 1997, 7, 165–78.
- Samuels, M.E.; Dubé, M.P. Linkage Mapping. In Encyclopedia of Genetics, Genomics, Proteomics, and Bioinformatics; John Wiley & Sons, Inc.: New York, 2005.
- Perlin, M.W.; Lancia, G.; Ng, S.K. Toward fully automated
genotyping: genotyping microsatellite markers
by deconvolution. Am. J. Hum. Genet.1995, 57,1199–1210. - Brownstein, M.J.; Carpten, J.D.; Smith, J.R. Modulation of non-templated nucleotide addition by Taq DNA polymerase: primer modifications that facilitate genotyping. Biotechniques1996, 20, 1004–6, 1008–10.
- Magnuson, V.L.; Ally, D.S.; Nylund, S.J.; Karanjawala, Z.E.; Rayman, J.B.; Knapp, J.I.; Lowe, A.L.; Ghosh, S.; Collins, F.S. Substrate nucleotide-determined non-templated addition of adenine by Taq DNA polymerase: implications for PCR-based genotyping and cloning. Biotechniques1996, 21, 700–9.
- Altshuler, D.; Brooks, L.D.; Chakravarti, A.; Collins, F.S.; Daly, M.J.; Donnelly, P. A haplotype map of the human genome. Nature2005, 437, 1299–1320.
- Greer, W.L.; Riddell, D.C.; Byers, D.M.; Welch, J.P.; Girouard, G.S.; Sparrow, S.M.; Gillan, T.L.; Neumann, P.E. Linkage of Niemann-Pick disease type D to the same region of human chromosome 18 as Niemann-Pick disease type C. Am. J. Hum. Genet. 1997, 61, 139–42.
- Greer, W.L.; Riddell, D.C.; Murty, S.; Gillan, T.L.; Girouard, G.S.; Sparrow, S.M.; Tatlidil, C.; Dobson, M.J.; Neumann, P.E. Linkage disequilibrium mapping of the Nova Scotia variant of Niemann-Pick disease. Clin. Genet. 1999, 55, 248–55.
- Carstea, E.D.; Morris, J.A.; Coleman, K.G.; Loftus, S.K.; Zhang, D.; Cummings, C.; Gu, J.; Rosenfeld, M.A.; Pavan, W.J.; Krizman, D.B.; Nagle, J.; Polymeropoulos, M.H.; Sturley, S.L.; Ioannou, Y.A.; Higgins, M.E.; Comly, M.; Cooney, A.; Brown, A.; Kaneski, C.R.; Blanchette-Mackie, E.J.; Dwyer, N.K.; Neufeld, E.B.; Chang, T.Y.; Liscum, L.; Strauss III, J.F.; Ohno, K.; Zeigler, M.; Carmi, R.; Sokol, J.; Markie, D.; O’Neill, R.R.; van Diggelen, O. P.; Elleder, M.; Patterson, M.C.; Brady, R.O.; Vanier, M.T.; Pentchev, P.G.; Tagle, D. Niemann-Pick C1 disease gene: homology to mediators of cholesterol homeostasis. Science1997, 277, 228–31.
- Greer, W.L.; Riddell, D.C.; Gillan, T.L.; Girouard, G.S.; Sparrow, S.M.; Byers, D.M.; Dobson, M.J.; Neumann, P.E. The Nova Scotia (type D) form of Niemann-Pick disease is caused by a G3097-->T transversion in NPC1. Am. J. Hum. Genet. 1998, 63, 52–4.
- Nickerson, D.A.; Tobe, V.O.; Taylor, S.L. PolyPhred: automating the detection and genotyping of single nucleotide substitutions using fluorescence-based resequencing. Nucl. Acids Res.1997, 25, 2745–51.
- Flood, E.M.; Tang, F.; Horvath, M.M.; Pertsemlidis, A.; Garner, H.R. SNPCEQer: detecting SNPs in sequences generated by the Beckman CEQ2000 DNA Analysis System. Biotechniques2002, 33, 814–20.
- Weckx, S.; Del-Favero, J.; Rademakers, R.; Claes, L.; Cruts, M.; De Jonghe, P.; Van Broeckhoven, C.; De Rijk, P. novoSNP, a novel computational tool for sequence variation discovery. Genome Res. 2005, 15, 436–42.
- Manaster, C.; Zheng, W.; Teuber, M.; Wachter, S.; Doring, F.; Schreiber, S.; Hampe, J. InSNP: a tool for automated detection and visualization of SNPs and InDels. Hum. Mutat. 2005, 26, 11–19.
- Crowe, M.L. SeqDoC: rapid SNP and mutation detection by direct comparison of DNA sequence chromatograms. BMC Bioinform. 2005, 6, 133.
- Benson, G. Tandem repeats finder: a program to analyze DNA sequences. Nucl. Acids Res.1999, 27, 573–80.
- Karolchik, D.; Baertsch, R.; Diekhans, M.; Furey, T.S.; Hinrichs, A.; Lu, Y.T.; Roskin, K.M.; Schwartz, M.; Sugnet, C.W.; Thomas, D.J.; Weber, R.J.; Haussler, D.; Kent, W.J. The UCSC Genome Browser Database. Nucl. Acids Res. 2003, 31, 51–4.
- Kent, W.J.; Sugnet, C.W.; Furey, T.S.; Roskin, K.M.; Pringle, T.H.; Zahler, A.M.; Haussler, D. The human genome browser at UCSC. Genome Res. 2002, 12, 996–1006.
- Jurka, J. Repbase Update: a database and an electronic journal of repetitive elements. Trends Genet. 2000, 16, 418–20.
- Jurka, J.; Kapitonov, V.V.; Pavlicek, A.; Klonowski, P.; Kohany, O.; Walichiewicz, J. Repbase Update, a database of eukaryotic repetitive elements. Cytogenet. Genome Res. 2005, 110, 462–7.
- Rozen, S.; Skaletsky, H. Primer3 on the WWW for general users and for biologist programmers. Meth. Mol. Biol. 2000, 132, 365–86.
- O’Connell, J.R.; Weeks, D.E. PedCheck: a program for identification of genotype incompatibilities in linkage analysis. Am. J. Hum. Genet. 1998, 63, 259–66.
Dr. Samuels is with the Department of Medicine, University of Montreal,
Centre de Recherche du Chum, Hopital Notre-Dame, Local
Y-3633, 2099 rue Alexandre de-Seve, Montréal QC H2L 2W5,
Canada; tel.: 514-890-8000; e-mail: [email protected]. Mr. Marcadier is currently with the Dalhousie Faculty of Medicine,
Halifax, Canada. Mr. Higgins and Dr. Bowman are with the
Atlantic Genome Centre, Halifax, Canada; Mr. Higgins is also
with the National Research Council Institute for Marine Biosciences,
Halifax, Canada. Ms. Provost and Dr. Dubé are with the Montreal
Heart Institute Research Center, Montréal, Canada. Dr. Blouin is
with the Faculty of Computer Science, Dalhousie University, Halifax,
Canada. The authors wish to thank Dr. Wenda Greer for the
Niemann-Pick DNA samples, and Drs. Andrew Orr and Duane
Guernsey for additional DNA samples. DNA sequence chromatograms
containing verified mutations are courtesy of Drs. Johane Robitaille,
Duane Guernsey, and Christie Riddell. The authors also wish
to thank the families and patients who generously contributed their
time and materials for this research. Dr. Samuels and Mr. Marcadier
were supported by Dalhousie University, the IWK Health Centre
(Halifax, Canada), the Dalhousie Medical Research Foundation,
Genome Atlantic, Genome Canada, and the Capital District Health
Authority. Mr. Higgins and Dr. Bowman were supported by Genome
Canada/Genome Atlantic. Dr. Dubé was supported by the Fonds de
Recherche en Santé du Québec (FRSQ). Dr. Blouin was supported by
Genome Canada and the Natural Sciences and Engineering Research
Council of Canada (NSERC).