Thermal analysis by structural characterization (TASC) combines with differential scanning calorimetry (DSC) and light microscopy to provide a powerful technique for characterizing polymers, pharmaceuticals and other materials. TASC is used to produce a thermal curve based on changes in features observed while a sample is heated or cooled.
In thermal analysis, a material’s physical properties are tracked as its temperature changes. The most widely used thermal analysis technique is DSC, which determines changes in heat flow and measures primary transitions such as melt and cure behavior, and secondary transitions like glass transition.
The temperature stages, or “hot” stages, used in the early days of thermal analysis, usually comprised a small furnace with a window above the sample through which to observe physical changes. A light microscope made it easy to see properties such as bulk melting and changes in color, but other reactions proved difficult to view, at best. This problem was solved by illuminating the sample with polarized white light delivered by a fiber-optic cable. The reflected light signal was then collected in a simple photodetector via a lens made to mimic the response of the human eye. The derivative of the reflected signal enabled even extremely small changes in reflected light intensity to be observed as a sharp peak. This method was used for temperature calibration of the stages by looking at the reflected light signal generated for a solid-state phase change, e.g., KNO3.1
Combining DSC and reflected light observations
 Figure 1 – DSC600 cell single sample stage.
The DSC600 VISTA system (Figure 1) (Linkam Scientific Instruments, Tadworth, U.K.) incorporates DSC and observations from reflected light. From a single experiment, heat flow, reflected light intensity and TASC curves are generated with simultaneous images of the sample to provide enhanced materials characterization. The complementary nature of these signals allows scientists to delve deeper into the relationship between structure and property changes within a material as a function of temperature.
The DSC is a low-mass single furnace that enables rapid heating and cooling rates (up to 100 °C/min) and a signal response time that replicates the high productivity and rapid sample turnaround of manufacturing processes. This is achieved using a liquid nitrogen cooling system (Linkam LNP95) for subambient operation and a water circulator (Linkam ECP) that ensures the stage body is kept at a constant temperature when operating at temperatures above 300 °C for prolonged periods.
Thermal analysts can use the DSC600 VISTA to observe the sample as it is heated or cooled while measuring transition temperatures and heats of transition; microscopists are able to visualize these changes by applying reflected light and image capture.
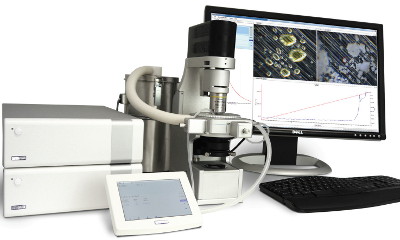 Figure 2 – DSC600 VISTA system shown with cooling system and control/analysis computer.
The thermal analyst typically works in a sealed environment like an aluminum pan, where it is not possible to observe the sample, while the microscopist usually prefers thin samples that can be observed with transmitted light. With the DSC600 VISTA, the sample can be imaged in an open pan in an environment that is sealed with a sapphire window. It is also possible to use sapphire pans in transmitted light mode. Figure 2 shows a Linkam imaging station with a stage to house the DSC and built-in lens and camera configuration.
The heart of the system is a silver heating block and single-temperature sensor onto which the sample pan is placed. The pan can be open for reflected light work or sealed for optimum calorimetric accuracy; pans and lids are available in aluminum and sapphire. The furnace and sensors are housed in a water-cooled aluminum block that contains purge gas and liquid nitrogen cooling port connectors. The entire stage can be mounted to most commercial light microscope systems.
TASC operation
After the images are taken, they are stored with the temperature, time, heat flow and reflected light data. Next, they are processed using TASC software (Cyversa, Norwich, U.K.) to generate curves based on the reflected light signal to show changes in sample features that occurred during the experiment.
For example, when a crystalline sample melts, there is significant loss of structure as the material changes from solid to molten form. This is observed in the heat flow signal of the DSC600. The signal can be used to measure the melting point, melting range and enthalpy of fusion for a crystalline material.
Figure 3a depicts four individual sucrose crystals (circled). Figure 3b shows the DSC melt curve; the green curve is the reflected light intensity.
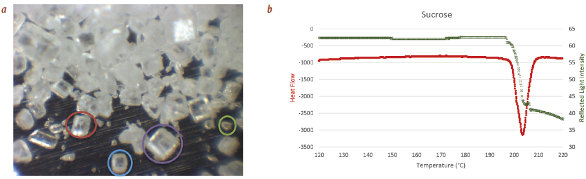 Figure 3 – a) Light micrograph of sucrose. b) DSC and reflected light intensity curves of sucrose crystal.
The heat-flow curve is an average of all the individual crystals that make up the material in the sample pan. Thus, DSC can be thought of as a “bulk” characterization method for all the material in the sample pan.
The crystals processed by the TASC imaging software across the melting range are shown in Figure 4. TASC characterizes how the structure of the material changes as a function of temperature or time. The TASC data are in arbitrary units (a.u.) and are normalized for each analysis.
 Figure 4 – Four TASC data sets of sucrose melt.
Figure 4 shows an overlay of the four analyzed crystals and illustrates one of the advantages of TASC—individual transition temperatures can be measured at different locations across the sample area. In addition to the excellent repeatability of the TASC signal, the signal is in agreement with the heat flow data from the DSC.
The same loss of structure exhibited during melting also occurs when a crystalline material dissolves, and the TASC software can track the dissolution of crystalline materials as a sample is heated or held isothermally.
When it is not possible to observe a change in a structure during heating, a pattern can be applied to the surface of the sample. For example, as polystyrene is heated, only minor changes in the surface shape and structure can be seen. This can be resolved by applying indentations. The pattern disappears as the sample is heated through the glass transition, and the polymer flows.
TASC and DSC
While DSC and TASC are complementary, TASC can reveal transitions that are difficult or impossible to measure easily by DSC since the enthalpy change is so small and the surface change is high. In TASC, sensitivity is not reduced with smaller samples and lower heating rates, as in DSC. DSC is a bulk measurement tool, while TASC permits the measurement and analysis of individual regions of the sample.
Conclusion
Studies being done at the University of East Anglia (Norwich, U.K.) for characterizing the complex formulations produced in the laboratory of Dr. Sheng Qi are revealing differences among polymer blends, used for drug delivery, that are not observed by DSC. This may in part be due to the greater sensitivity of TASC in detecting surface changes, whereas DSC is measuring the bulk properties of the material. In a series of drug-loaded polymer samples, TASC detected a double transition, but the heat-flow measured by DSC found only one. Such behavior may be due to the melting of different crystal forms (see Figure 5).
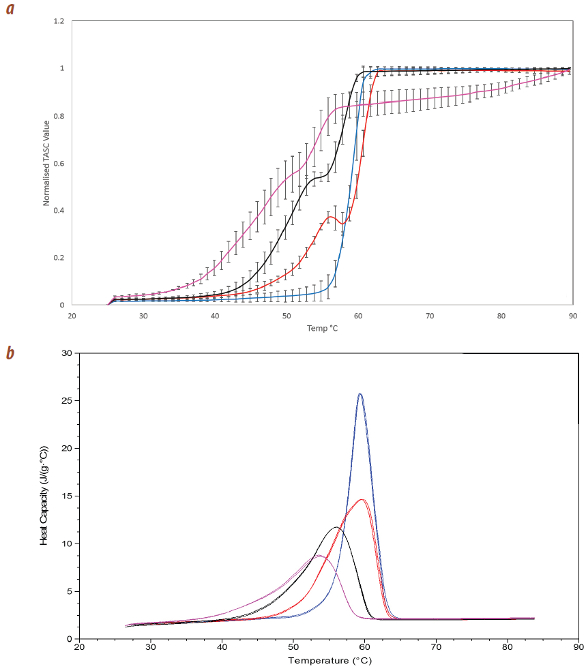 Figure 5 – a) TASC and b) DSC curves showing different drug-loaded polymer samples.
This work underscores the potential for TASC. The technique provides localized analysis of clearly identified sample features on the micro scale and measurements over much larger areas, and thus is useful for studying heterogeneity. Dr. Qi’s group has reported on the simplicity of TASC and its ability to detect subtle transitions that are not detectable using conventional techniques like DSC.2
References
- Haines, P.J. and Skinner, G.A. Simultaneous differential scanning calorimetry and reflected light intensity measurement. Thermochim. Acta. 1982, 59, 343-59.
- Alhijjaj, M.; Reading, M. et al. Assessment of the Heterogeneity of Complex Drug Delivery Systems Using Thermal Analysis by Structural Characterisation (TASC). Poster—TAC 2015, Cambridge, UK. Royal Society of Chemistry, Thermal Methods Group.
Professor Mike Reading is a research professor at the University of Huddersfield, U.K. Dr. Duncan Stacey is sales and marketing manager, Linkam Scientific Instruments, Unit 8 Epsom Downs Metro Centre, Tadworth, Surrey KT20 5LR, U.K.; tel.: +44 (0)1737 363 476; e-mail: [email protected]; www.linkam.co.uk. The authors thank Dr. Sheng Qi and Ph.D. student Muqdad Alhijjaj for sharing their work. TASC products are a family of techniques developed by Cyversa (Norwich, U.K.) and are covered by a European Patent.