Examples of polysaccharides, widely used as food additives and in certain medical applications, include derivatives of cellulose and starch, such as hydroxymethyl cellulose and maltodextrin, respectively; dextrans; and a group of materials increasingly referred to as renewable polymers: xanthan gum, hyaluronic acid, alginates and gum arabic. Polysaccharides occur naturally and are produced by extraction from a plant or animal-based feedstock, rather than being synthesized in polymerization reactions. Such feedstocks have inherent variability, making it difficult to ensure consistent product quality.
The performance, and in some cases the safety, of polysaccharide-based products depends on their molecular weight (MW), MW distribution and structure. If the MW of the polysaccharide is too high, then the final product may be too brittle and/or firm, while a low MW may result in a far more weakly structured product and other behavioral abnormalities. Furthermore, at low MW, polysaccharides tend to be linear, but as MW increases, so does the likelihood that the molecule will branch. Branching also directly influences performance in a finished product, so controlling both properties is crucial to ensure a safe and efficacious product that behaves as required.
Gel permeation/size exclusion chromatography (GPC/SEC) is used routinely to study the MW and structural characteristics of macromolecules and is useful for polysaccharide characterization. This article examines the information that can be generated using the latest GPC/SEC technology, which brings the sensitivity needed to differentiate similar polysaccharide samples, and the complementary application of flow injection polymer analysis (FIPA), which facilitates application of GPC/SEC in the manufacturing environment.
Importance of polysaccharide characterization
The need to characterize polysaccharides reliably and comprehensively is shared by those manufacturing polysaccharide-based additives and excipients and the formulators that use them. In the food industry, for example, such additives are routinely used as thickeners and gels and are produced by subjecting natural feedstocks to extraction under closely controlled conditions. Pectin, for instance, is produced from fruit, while carrageenan derives from seaweed.
Raw feedstocks for these products may be purchased from numerous suppliers; constituted different, naturally occurring species; and resourced from a wide range of geographies. As a result, they contain a variety of polysaccharide populations, or grades, making optimization of the extraction processes an ongoing challenge. Ensuring consistent, well-defined product quality in the face of this variability relies on timely measurement of the MW of the polymer exiting the extraction process, and analysis of polymeric structure. These measurements support the effective manipulation of extraction conditions to properly grade the product to maintain consistent and desirable quality.
Formulation requires an understanding of the structure–function relationships that define the impact of an additive on finished product performance. Here, the MW, MW distribution and structure of a specific additive or grade of additive impact functionality—the rheology of a finished gel, for example, gelation times and compatibility between the additive and other formulation ingredients. Formulators therefore rely on characterization data to differentiate the grades of additive that are commercially available in a way that correlates with their performance, and to identify those features of the polymer that are crucial to delivery of formulation targets. Such data supports effective decision-making as regards additive and supplier choice.
This reliance on MW and structural data makes sensitive, informative characterization of polysaccharides valuable to manufacturers and formulators. The ability to reliably detect subtle differences between samples facilitates extraction optimization and consistent product quality and, for formulators, enables knowledge-driven use. Advances in characterization technology therefore have considerable commercial value.
Tailoring GPC/SEC to meet industrial requirements
All polymers have a chain-like structure, and the majority of commercial products contain chains of differing length. The popularity of GPC/SEC as a standard method for polymer analysis stems from its ability to access the property distributions that polymers consequently exhibit, rather than measuring averaged values. A two-step technique, it involves separation of the sample on the basis of hydrodynamic size, using a packed chromatography column, followed by characterization of the eluting fractions with one or more detectors.
Early implementations of GPC/SEC used a single concentration detector to measure the amount of material in each size fraction; this type of simple setup remains in routine use for QC. An MW distribution is generated from the sized fractions via calibration with an appropriate set of standards. However, this approach produces only relative (to the standard) MW data and is limited by the availability of suitable standards since chemical and structural differences between the sample and the standard will lead to errors. Furthermore, it fails to exploit the full range of information that GPC/SEC can offer. In the last decade or so, a multidetector array has become the norm, incorporating three or more of the following:
- Refractive index (RI) detector for measuring concentration
- UV/VIS detector (single or multiple wavelength) for measuring concentration and/or for the detection of specific chromophores within a multicomponent system such as a co-polymer
- Light scattering (LS) detector for measuring absolute MW directly with no requirement for calibration with a specific, relevant standard
- Viscometer for measuring intrinsic viscosity (IV), a measure of molecular density that can be used in combination with MW data to determine molecular size and investigate structural characteristics.
The information provided by multi-detector GPC/SEC makes it the technique of choice for development work and for investigative product and process optimization. However, analytical times can be relatively long—around 20 to 30 minutes—limiting its application at a process line, for the direct control of extraction or polymerization processes. This issue can be addressed through the adoption of flow injection polymer analysis (FIPA), a technique that can be considered a subset of GPC/SEC.
A FIPA setup is similar to that of a standard GPC/SEC system and may include multiple detectors, but the separation medium/column used is different. The stationary phase of a GPC/SEC/FIPA column is made of up gel particles with voids of well-defined dimensions. In a GPC/SEC column, the size distribution of these voids is chosen so that smaller molecules in the sample diffuse into the pores, slowing their progress through the column, while larger molecules do not (see Figure 1). This produces a size-fractionated sample from which distributed properties can be determined.
 Figure 1 – A FIPA setup is similar to a standard GPC/SEC configuration with the exception of the stationary phase in the column, which is specified to simply separate the solvent from the polymer sample.
A FIPA column uses the same stationary phase as applied for GPC/SEC, but with a finer pore structure into which only the solvent molecules can diffuse. FIPA analysis therefore simply separates the dissolved polymer from the solvent, which elutes separately (Figure 1). That the polymer and solvent elute separately is important since it gives rise to narrow, tall elution peaks that result in high measurement sensitivity. This is especially useful for samples containing, for example, low-MW material. More importantly, analysis times are substantially reduced—to around 10 minutes, around a third of the time needed for a typical GPC/SEC analysis. However, any results generated from the measurement are average values, rather than the full distributions that GPC/SEC is typically prized for, since the polymer itself is not split into discrete size fractions. Choosing FIPA over GPC/SEC is a trade-off—a reduction in information for a faster result (see Figure 2).
 Figure 2 – While GPC/SEC (blue) provides distributed metrics, by causing a full separation of the polymer on the basis of hydrodynamic size, FIPA (turquoise) simply provides averaged values of molecular weight, by splitting the polymer and solvent.
Recent developments in GPC/SEC technology have focused on boosting the sensitivity, ease-of-use and productivity of multi-detector setups to maximize the information gathered, relative to the time invested, and increase process and product understanding. FIPA makes it easier to capitalize on that understanding within the process environment by enabling the setting and application of a specification that can be measured in a time scale that more closely matches manufacturing requirements.
Enhancing the performance of GPC/SEC systems
GPC/SEC instrumentation that is easier to use and more productive is commercially essential because of its pivotal role in polymer characterization.
Greater sensitivity is also valuable because it permits the measurement of accurate data with less sample. This can be critical during the early stages of development when material is scarce. On the other hand, for those processing naturally occurring feedstocks, increased sensitivity enables the detection of more subtle differences between supplies, provides greater assurance of product consistency and supports more effective process optimization.
The two-step nature of GPC/SEC calls for a holistic approach to optimizing analytical performance. State-of-the-art systems have fully integrated separation and detection to maintain the integrity of the sample during measurement through effective temperature control. Integration also minimizes the band broadening that can occur when detectors are connected suboptimally. High-performance separation modules cleanly separate the sample, delivering precise resolution and a smooth, stable baseline that maximizes the signal-to-noise ratio achieved during detection. The latest light-scattering detectors use a fiber-delivered laser to maximize sensitivity, while new viscometer designs are self-balancing to boost the accuracy and integrity of each experiment. These advances can provide considerable benefit in polysaccharide characterization, as shown below.
Case study: Using GPC/SEC to measure the MW and structure of polysaccharides
Ten dextran samples of different MW were analyzed using an OMNISEC GPC/SEC system (Malvern Instruments, Malvern, Worcestershire, U.K.) with triple-detector array: RI, LS and viscometer. Samples were prepared in an aqueous mobile phase of 0.05 M Na2SO4 and analyzed using two A6000M columns (Malvern) at a flow rate of 1 mL/min.
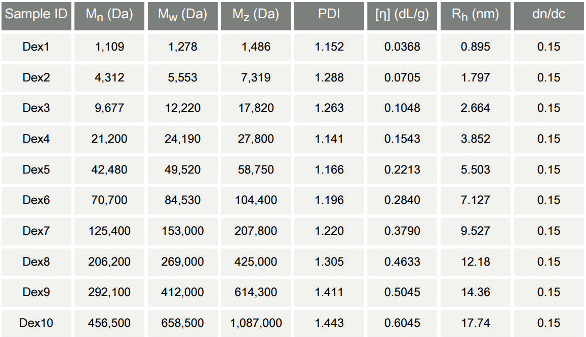
Figure 3 shows the clean, smooth chromatograms obtained, which are evidence of good separation performance and signal-to-noise ratios. The samples were found to vary in MW from around 1 kDa to 1000 kDa, with accurate data obtained across the full MW range. Table 1 summarizes all the data delivered by the triple detector array, which includes IV ([η]) and hydrodynamic radius (Rh), in addition to MW distribution metrics.
 Figure 3 – Smooth peaks and clean baselines ensure highly accurate MW measurement for all 10 dextran samples, which vary considerably in terms of their MW.
Table 1 – Multi-detector GPC/SEC produces information that can be used to investigate polysaccharide structure, in addition to measuring MW
To compare the structures of the different dextran samples, the gathered data were used to construct a Mark-Houwink (M-H) plot (Figure 4). This log-log plot of IV against MW is used to easily identify structural differences between polymeric samples, the extent of chain branching, for example, or cross-linking. The M-H traces for the 10 dextran samples overlap, falling on the same overall line, indicating that they are structurally similar, though different in MW.
 Figure 4 – An M-H plot reveals that the 10 dextran samples (multiple colors) all have very similar structure, while that of the gum arabic (blue) and pectin (turquoise) are markedly different.
For comparative purposes, analogous experiments were carried out with two additional samples: one pectin and the other gum arabic. Figure 4 includes the M-H plots for these samples alongside those of the dextran series.
Gum arabic is routinely used as a stabilizer and/or binder for food. It has the highest molecular density of all of the samples tested and therefore exhibits the lowest IV at any given MW. The M-H plot for this sample occupies the lower region of the M-H graph. Pectin, in contrast, has a relatively high IV at any given MW and occupies a much higher area of the M-H graph. This high IV is responsible for pectin’s ability to increase the viscosity of a solution and act as an effective gelling agent. Via the M-H plots, the structure of the dextran samples can be securely identified as consistent and clearly contrasted with the structurally different pectin and gum arabic.
Extending analysis to the processing environment
Once high-performance GPC/SEC has been used to investigate product properties in detail and establish appropriate specifications and/or processing conditions, FIPA can be used as a process analysis tool to maintain that specification, and consequently product quality, during manufacture. Consider, for example, a food additive manufacturer producing pectin from fruit pulp bought on the open market at sites across the globe. Each supply is subtly different, since the MW and structure of pectin, even in any given fruit, changes from variety to variety, as a result of the weather, or across samples of the same variety grown in different geographies. For each new supply, the extraction conditions applied therefore need to be reoptimized to ensure the efficient manufacture of consistent product.
Development chemists/engineers complete this reoptimization step in the laboratory or pilot-scale facility using GPC/SEC to rigorously assess the MW distribution and structure of the naturally occurring polysaccharide and the extracted product. However, once extraction conditions have been established, the analytical requirement changes and it becomes sufficient simply to check that the extraction is proceeding as expected. An averaged metric is often all that is needed for this purpose. Thus full-scale manufacture can be monitored using FIPA rather than GPC/SEC, which is retained for a final QC check. Because FIPA techniques are quicker and simpler, the rollout of specifications on this basis is a straightforward, cost-effective way to ensure consistent operation at each site across the globe.
Conclusion
Accurate MW distribution data and structural information is essential for effective polysaccharide characterization. The results presented show how GPC/SEC can be employed to accurately and directly measure these properties with state-of-the-art systems now offering the sensitivity and productivity needed to exert exacting control over polysaccharide behavior. For additive manufacturers, these systems make it faster and easier to optimize extraction and ensure that product consistency meets tight tolerances. The complementary use of FIPA brings value by speeding up analysis during manufacture, enabling the timely measurement needed to achieve effective process control.
Stephen Ball is product marketing manager, Malvern Instruments Ltd., Enigma Business Park, Grovewood Rd., Malvern, Worcestershire, WR14 1XZ, U.K.; tel.: +44 (0) 1684 892456; www.malvern.com