Due to its unique physical and chemical properties, rhodium has been used as a catalyst in organic synthesis, as an alloy in thermocouples, as a raw plating material in electronic instruments and as a component in the three-way catalysts in automobile exhaust systems.1 A substantial increase in emissions necessitates a reliable analytical technique to assess and study the impact of rhodium on the environment.
Laser thermal lens spectrometry (TLS) is an advanced molecular absorption technique based on the measurement of local changes in refractive index of medium due to a rise in temperature produced by nonradiative relaxation upon the absorption of laser radiation, proportional to the concentration of the absorbent.2,3 The method allows determination of absorbance down to 10-8 and detection of analytes at the 10-11 mol L-1 level.4–7 While known for its high sensitivity, TLS suffers from low selectivity.7
Used for separation and preconcentration, cloud point extraction (CPE) is convenient, safe, simple to use, low in cost, offers high preconcentration in comparison to conventional liquid–liquid extraction and does not use toxic organic solvent—thus it is characterized as a “green” extraction technique.8–10 CPE has been used successfully in conjunction with many analytical techniques,11–19 but little information is available on the coupling of CPE and TLS.20–24
Cloud point extraction/laser thermal lens spectrometry
The current study combined CPE with TLS for the determination of trace rhodium in water samples. As the ligand, 2-(3,5-dichloro-2-pyridylazo)- 5-dimethylaminoaniline (3,5-diCl-PADMA) was chosen because it is a good chromogenic reagent for the determination of rhodium,25 and the maximum absorption wavelength of its rhodium complex (624 nm) is well matched to the wavelength of the He–Ne laser (632.8 nm); octylphenoxypolyethoxyethanol was selected as the extractant because its cloud point is in the range of 23–25 °C.
Experimental
Apparatus
Thermal lens measurements were carried out with a laboratory-built single-beam laser thermal lens spectrometer.26 A Model PS-THN-1200 continuous-wave (CW) He–Ne laser (Shanling Laser and Electronic Appliance Co. Ltd., Shanling, China) (9632.8 nm, TEM00, 25 mW) was used as both excitation and probe beam. The laser beam was modulated by a Model 197 chopper (Signal Recovery, part of Ametek Advanced Measurement Technology, Broussard, La.) at 10 Hz and focused onto a 5-mm quartz cell located at the confocal distance by a 150-mm focal-length lens. Signal was detected as the far-field beam intensity change through a 0.5-mm pinhole with a photoelectric device located 2.4 m from the sample cell, and was processed with a Model DS5102M digital storage oscilloscope (Beijing Rigol Electronic Co. Ltd., Beijing, China) connected to a personal computer. The thermal lens signal is given by Eq. (1)22:
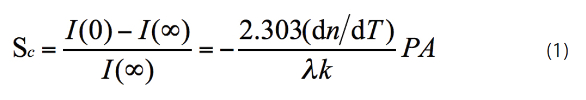
Where I(0) and I(∞) are intensities of the laser beam passing though the sample cell during the thermal lens effect at initial time and steady state time; P and λ are the power and wavelength of the laser; and A, dn/dT and k are the absorbance, temperature coefficient of refractive index and conductivity of the sample, respectively.
Absorption spectra were recorded using a TU-1810 spectrophotometer (Beijing Puxi General Co. Ltd., Beijing, China) equipped with a 1-cm quartz cell. The pH measurements were performed by a pHS-2C digital pH meter furnished with a combined glass electrode (Shanghai Leici Instruments Factory, Shanghai, China). An HH-2 thermostatic water bath (Beijing Kewei Yongxing Instrument Co. Ltd., Beijing, China) maintained the temperature in the CPE experiments. A Model 800 centrifuge (Shanghai Pudong Physical Instruments Factory, Shanghai, China) was used to accelerate phase separation.
Reagents and solutions
All chemicals and reagents were of analytical grade unless otherwise stated. Double-distilled water was used in the preparations. A standard stock solution of rhodium (1000 μg/mL) was prepared by dissolving 0.3248 g of spectrographically pure (NH4)2 RhCl5·H2O in 100 mL 1 mol L-1 HCl. The working solutions were obtained by stepwise dilution of the stock solution with water. A 5 × 10⁻⁵ mol L-1 3,5-diCl-PADMA (laboratory-synthesized27) solution was prepared by dissolving 0.1551 g 3,5-diCl-PADMA in 1000 mL absolute ethanol. A 1% (w/v) Triton X-114 (Sigma-Aldrich, St. Louis, Mo.) water solution was made. Buffer solution of pH 5.0 was prepared from 0.2 mol L-1 HAc and 0.2 mol L-1 NaAc solution; 2.67 mol L-1 HCl-alcohol solution was prepared by mixing 8 mol L-1 HCl solution with ethanol by a volume ratio of 1:2.
General procedure
An aliquot of the working standard or sample solution containing appropriate amounts of rhodium, 2 mL pH 5.0 HAc-NaAc buffer solution and 80 μL of 5.0 × 10⁻⁴ mol L-1 3,5-diCl-PADMA ethanol solution was placed in a 10-mL graduated conical centrifuge tube. The mixture was heated in a boiling water bath for 20 min. For cloud point extraction, 0.8 mL of 1% (w/v) Triton X-114 solution was added and the solution was diluted to 10 mL with water. This solution was shaken and kept in a thermostat-controlled bath at 60 °C for 10 min. Separation of the two phases was then accelerated by centrifugation at 3500 rpm for 5 min. Upon cooling in an ice bath for 10 min, the surfactant-rich phase became viscous and remained at the bottom of the tube. Bulk aqueous phase was discarded by inverting the tube. The surfactant-rich phase in the tube was dissolved with 0.45 mL 2.67 mol L-1 HCl-alcohol solution. Next, the final solution was introduced into a 5-mm optical pathlength quartz cell to measure the thermal lens signal (Sc) by the thermal lens spectrometer at a wavelength of 632.8 nm and chopper frequency of 10 Hz.
Results and discussion
Absorption spectra and wavelength selection
The absorption spectra of 3,5-diCl-PADMA and its Rh(III) (rhodium chloride) complex in the surfactant-rich phases after dissolving with HCl-ethanol solution were recorded (Figure 1). It can be seen that the reagent exhibits maximum absorption at 444 nm, while the Rh(III) complex exhibits maximum absorption at 624 nm, which is well matched to the wavelength of the He–Ne laser (632.8 nm).
 Figure 1 – Absorption spectra: 1) 3,5-diCl-PADMA vs water. 2) Rh(III) complex vs reagent blank. Conditions: 1.0 × 10⁻⁵ mol L-1 3,5-diCl-PADMA; 87.5 ng Rh(III), 1-cm cell.
Effect of acidity
The chelating agent 3,5-diCl-PADMA showed acid–base indicator properties. Four species—H3L+, H2L2+, HL+ and L—are included in the solution because of the protonation of the ring nitrogen and two amino group nitrogen atoms. Distribution of these species in solution is determined by the acidity. pH therefore plays an important role in the formation and hydrophobicity of the chelate, as well as extraction. Figure 2 shows the influence of pH on the thermal lens signal of the rhodium complex. A maximum thermal lens signal was obtained at pH 4.6–5.2; pH 5.0 was thus chosen for subsequent experiments.
 Figure 2 – Effect of pH on thermal lens signal—0.08 mL 5 × 10⁻⁴ mol L-1 3,5-diCl-PADMA; 0.8 mL 1.0% (w/v) Triton X-114; temperature: 60 °C, heating time: 10 min; 25 ng Rh(III).
Effect of chelating agent
Because 3,5-diCl-PADMA was sparse in water, ethanol was chosen as the solvent for preparing the chelating agent solution. The 3,5-diCl-PADMA concentration affects the rhodium extraction, that is, the lower the concentration, the larger the volume of solution that will be used. This means that more ethanol will enter the CPE system, which will prevent micelle formation and reduce extraction efficiency. To reduce the volume added, a higher concentration of 3,5-diCl-PADMA solution (5.0 × 10⁻⁴ mol L-1) was used.
The effect of 5.0 × 10⁻⁴ mol L-1 3,5-diCl-PADMA on the thermal lens signal was investigated within the range of 10–150 μL (see Figure 3). The thermal lens signal first increased and then remained stable in the presence of 30–120 μL 5.0 × 10⁻⁴ mol L-1 3,5-diCl-PADMA. When an excess amount of 3,5-diCl-PADMA was used, a gradual decrease in the thermal lens signal was observed. As 3,5-diCl-PADMA also has strong hydrophobicity, there was more 3,5-diCl-PADMA and less Rh(III)-3,5-diCl-PADMA complex in the surfactant-rich phase with increasing amounts of 3,5-diCl-PADMA. Hence, 80 μL of 5.0 × 10⁻⁴ mol L-1 3,5-diCl-PADMA was chosen for subsequent experiments.
 Figure 3 – Effect of 3,5-diCl-PADMA on thermal lens signal—0.8 mL 1.0% (w/v) Triton X-114; temperature: 60 °C, heating time:10 min; pH = 5.0; 25 ng Rh(III).
Effect of Triton X-114 concentration
The nonionic surfactant Triton X-114 was selected as the extractant because it is commercially available in a highly purified homogeneous form, inexpensive, offers lower toxicity and has a cloud point of 23–25 °C. The high density of the surfactant-rich phase facilitates separation by centrifugation. Figure 4 shows the variation of the thermal lens signal as a function of the concentration of Triton X-114. The maximum thermal lens signal was obtained in the volume range of 0.4~1.0 mL 1.0% (w/v) Triton X-114. At lower concentrations, the analytical signal is low probably due to the inability of the assemblies to entrap the hydrophobic complex quantitatively. With an increase in Triton X-114 to above 1.0 mL, the signals decrease because of the increasing volumes of the surfactant phase. Therefore, 0.8 mL 1.0% Triton X-114 was used in the proposed method.
 Figure 4 – Effect of Triton X-114 on the thermal lens signal—0.08 mL 5 × 10⁻⁴ mol/L 3,5-diCl-PADMA; temperature: 60 °C, heating time: 15 min; pH = 5.0; 25 ng Rh(III).
Effect of equilibrium temperature and time
Equilibrium temperature and time are critical parameters to achieve effective phase separation. In general, the optimal equilibration temperature of CPE is 15–20 °C higher than the cloud point temperature. The influence of equilibrium temperature on extraction efficiency was studied in the range of 40–80 °C. When equilibrium temperature was higher than 50 °C, good phase separation was obtained and the thermal-lens signal remained stable. Therefore, a temperature of 40 °C was used throughout. Dependence of the thermal-lens signal on equilibration time was studied in the 5–30 min range. An equilibration time of 10 min was adequate to achieve quantitative extraction, and the increase in equilibration time had no significant effect on the thermal lens signal.
Effect of the solvent
The color reaction of the chelating agent 3,5-diCl-PADMA with Rh(III) was reported in detail elsewhere.24 In the pH range of 4.0~5.2, Rh(III) reacts with 3,5-diCl-PADMA to form a 1:2 violet-red complex (RhL2, λmax = 554 nm). The complex can be changed to another blue di-proton species (RhL2H22+, λmax = 614 nm) having much higher absorption after acidification with HCl. Optimal concentration of HCl was found to be 0.72~6.0 mol L-1. Complexation of Rh(III) with 3,5-diCl-PADMA is shown in Figure 5.
 Figure 5 – Complexation of Rh(III) with 3,5-diCl-PADMA.
As a themooptical analytical technique, the sensitivity of TLS is similar to the thermophysical properties of the solvent.3,28,29 As seen in Eq. (1), the intensity of thermal lens signal is proportional to the temperature-dependent refractive index (dn/dT) and thermal conductivity (k). Due to its low dn/dT and k values, water is a poor solvent for TLS. Organic solvents have much better thermooptical properties than water because of the higher dn/dT and k values.
In order to match the wavelength of the He–Ne laser (632.8 nm) and enhance the thermal lens signal, the surfactant-rich phase after CPE should be dissolved with HCl and organic solvent. The organic solvent should be environmentally friendly, readily soluble with HCl and have a higher signal enhancement factor. In addition, the maximum absorption wavelength of the complex (RhL2H22+) should be as close as possible to the wavelength of the He–Ne laser. In the most commonly used solvents, ethanol can meet these requirements. Therefore, 2.67 mol L-1 HCl–ethanol solution was used as the solvent medium for dissolving the remaining phase after CPE as well as for TLS measurement. In this medium, the complex (RhL2H2 2+) exhibited a maximum absorption at 624 nm, which is close to the wavelength of the He–Ne laser.
Effect of foreign species
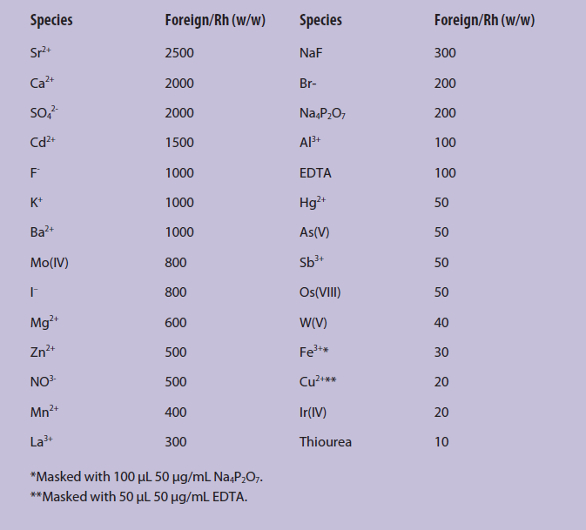
The effects of foreign species on the determination of 2.5 ng/mL rhodium were investigated. Tolerance limit was defined as the amount of added species causing a ±5% variation in the thermal lens signal of the sample. Results of the interference study are shown in Table 1.
Table 1 – Effect of foreign ions on preconcentration/determination of rhodium
Analytical features
Using the optimized experimental conditions for preconcentration of rhodium, a calibration graph obtained by the proposed method showed linearity over the range of 0.2~5.0 ng/mL. The linear regression equation is Sc = 0.7837c-0.0855, where Sc is the intensity of thermal lens signal and c is the rhodium concentration in ng mL-1, and the correlation coefficient r was 0.9981. The detection limit (DL), calculated as three times the standard deviation of the blank solution (3σ), was 0.04 ng mL-1. The relative standard deviation (RSD) was 3.0% (n = 11, c = 1.0 ng mL-1). Compared with the conventional spectrophotometric method,24 sensitivity of the method calculated as the ratio of the slopes of the calibration curves was enhanced 570 times. The enrichment factor, defined as the ratio of the volumes before and after CPE, was 22.
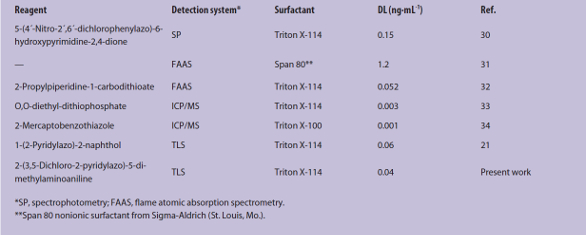
Table 2 compares the proposed method with previously reported methods using CPE prior to rhodium determination. As seen, the detection limit of the new method is better than those given in the table, with the exception of CPE-ICP/MS.32,33
Table 2 – Comparison of proposed method with reported methods using CPE prior to rhodium determination
Analysis of real samples
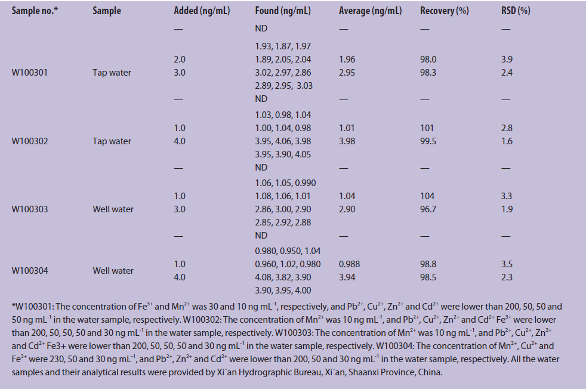
Method validation was performed by using the technique for the determination of rhodium in water samples. Five milliliters of each water sample was added to a 10-mL graduated conical centrifuge tube, along with 100 μL 30 μg/ mL Na4P2O7 and 50 μL 50 μg/mL EDTA solution. Recoveries (see Table 3) were within the range of 96.7–104%.
Table 3 – Determination of rhodium in water samples
Conclusion
TLS is a highly sensitive thermo-optical analytical method that suffers from low selectivity. CPE is a powerful technique for the preconcentration and separation of metal ions. The combined method proposed here achieved satisfactory results when applied to the determination of rhodium in real water samples.
References
- Dubiella-Jackowska, A.; Polkowska, Z. et al. Polish J. Environ. Studies 2007, 16(3), 329–45.
- Dovichi, N.J. CRC Crit. Rev. Anal. Chem. 1987, 17(4), 357–423.
- Dovichi, N.J. Prog. Anal. Spectrosc. 1988, 11, 179–207.
- Han, Q. and Yan, H.T. Prog. Chem. 2002, 14(1), 24–31.
- Han, Q.; Yan, H.T. et al. Chin. J. Chem. 2004, 22(10), 1170–3.
- Zhirkov, A.A.; Benddrysheva, S.N. et al. J. Anal. Chem. 2008, 63(11), 1066–72.
- Tsarkov, D.S.; Ryndina, E.S. et al. J. Anal. Chem. 2011, 66(2), 170–4.
- Shen, J.C. and Shao, X.G. Prog. Chem. 2006, 18(4), 482–7.
- Ojeda, C.B. and Rojas, F.S. Anal. Bioanal. Chem. 2009, 394, 759–82.
- Ojeda, C.B. and Rojas, F.S. Microchim. Acta 2012, 177, 1–21.
- Afkhami, A. and Bahram, M. Microchim. Acta 2006, 155, 403–8.
- Hassanien, M.M.; Abdel-Rhman, M.H. et al. Transition Met. Chem. 2007, 32, 1025–9.
- Oya, A.U.; Zeynep, Y.G. et al. Environ. Chem. Lett. 2014, 12, 449–53.
- Zhu X.S.; Zhu Z. et al. Microchim. Acta 2008, 161, 143–8.
- Filik, H. and Aksu, D. Food Anal. Methods 2012, 5, 359–65.
- Chen, J.G.; Chen, H.W. et al. J. Anal. Sci. 2009, 25(3), 262–6.
- Zou, D.Q. and Qing, Y. J. Iran. Chem. Soc. 2014, 11, 415–22.
- Bozkurt S.S. and Ocakoglu, K. Microchim. Acta 2012, 177, 47–52.
- Wen, S.G. and Zhu, X.S. Food Anal. Methods 2013, 6, 506–11.
- Shemirani, F. and Shokoufi, N. Anal. Chim. Acta 2006, 577, 238–43.
- Shokoufi, N. and Shemirani, F. Talanta 2007, 73, 662–7.
- Shokoufi, N.; Shemirani F. et al. Spectrochim. Acta A 2009, 74, 761–6.
- Shokoufi, N. and Atrabi, R.J. J. Anal. Sci. Technol. 2014, 5, 39–44.
- Han, Q. and Huo, Y.Y. Anal. Lett. 2015, 48, 2096–2106.
- Han, Q. and Wu, Q.X. Precious Metals 1993, 14(4), 55–8.
- Han, Q.; Hao, T.T. et al. Chin. J. Anal. Lab. 2014, 33(5), 574–7.
- Han, Q. and Wu, Q.X. Chem. Reagents 1992, 14(4), 241–2.
- Arnaud, N. and Georges, J. Spectrochim. Acta Part A 2001, 57(6), 1295–1301.
- Ramis-Ramos, G. Anal. Chim. Acta 1993, 283, 623–34.
- Mohammed, A.K. and Alaa, S.A. Spectrochim. Acta Part A 2015, 136,1955–61.
- Roushani, M.; Baghelani, Y.M. et al. Quim. Nova 2014, 37(8), 308–11.
- Suvardhan, K.; Suresh, K.K. et al. Microchim. Acta 2007, 157, 237–44.
- Mesquita da Silva, M.A.; Azzolin Frescura, V.L. et al. Spectrochim. Acta Part B 2001, 56, 1941–9.
- Simitchiev, K.; Stefanova, V. et al. J. Anal. At. Spectrom. 2008, 23, 717–26.
Quan Han, Xiaohui Yang, Huo Yanyan and Yaping He are with the School of Chemical Engineering, Xi’an University, Xi’an 710065, China, No. 1, Keji Rd., Xi’an, Shaanxi, China; tel.: +86-29-88258506; e-mail: [email protected]; www.xawl.org. Quan Han and Na Yang are with the School of Chemistry, Shaanxi Normal University, Xi’an, China. This work was supported by National Natural Science Foundation of China (No. 21545014, 21445004) and the Xi’an Science and Technology Plan Project (No. CXY1531WL22; CXY1531WL34).