Functionalized polyolefins, such as copolymers of ethylene vinyl acetate (EVA), are a commercially important polymer commodity. Depending on their comonomer content, these materials find application in the production of foams, films, and hot melt adhesives. The polyolefin market is growing by 5–6% annually due to its versatile physical and mechanical properties, low cost, and easily available raw materials.1 As a result, the characterization of functionalized polyolefins has become an important area in polymer research.2
Olefin copolymers are generally distributed with regard to various parameters such as chemical composition, molar mass, functionality, degree of branching, block length, and tacticity. Comprehensive characterization of the interrelationship between these distributions is therefore essential to understanding the catalyst performance, as well as to optimizing the synthesis and structure–property relationships. In the case of functionalized polyolefins, the most important distributions are molar mass distribution (MMD) and chemical composition distribution (CCD), and their interrelationship is referred to as chemical heterogeneity.
A number of fractionation techniques are commonly used in polyolefin analysis. High-temperature-size exclusion chromatography (HT-SEC) is the established method to determine the MMD. SEC separation is based on the size of the molecules in solution (hydrodynamic volume) and the extent to which they are excluded from the pores of a stationary phase. The MMD and corresponding molar mass averages can be obtained from a calibration curve that relates the molar mass to the elution volume, or by using on-line molar mass detectors such as light scattering or viscosimetry. However, the size of a macromolecule in solution is also influenced by its molecular architecture, such as branching, and by the chemical composition via affinity toward the used solvent. This means that macromolecules having the identical hydrodynamic volume but different chemical composition may coelute at the same elution volume in SEC.
Crystallization fractionation (CRYSTAF) and temperature-rising elution fractionation (TREF) are commonly used to determine the CCD of semicrystalline olefin copolymers. Both techniques utilize the relationship between comonomer content and the crystallizability from a hot dilute solution, which is derived from Flory’s theory. 3 TREF can also be hyphenated with SEC to reveal the full chemical heterogeneity.4,5 This can be done either off-line4 or on-line.5 However, the entire approach is limited to well-crystallized samples; thus samples with a higher content of comonomer (>10 wt%) cannot be studied in this way. Another drawback is that TREF is a relatively time-consuming technique.
The method of choice when it comes to separating complex polymers with regard to their chemical composition is HPLC. Separation in HPLC can be achieved via different mechanisms, including adsorption–desorption and precipitation–redissolution.6 However, HPLC has thus far been limited to polymers that are soluble at room temperature. The authors’ group developed the first interactive HPLC systems for the separation of functionalized polyolefins at high temperatures.7–9 It was shown that EVA copolymers,7–9 ethylene methyl acrylate copolymers,8 and ethylene butyl acrylate8 can be separated according to their chemical composition at a temperature of 140 °C using silica gel as stationary phase and gradients of nonpolar/polar solvents as mobile phase. To characterize the chemical heterogeneity, i.e., the relationship of CCD and MMD (hyphenation of interactive HPLC with SEC), 2D-LC separation is required. The advantages and disadvantages of using either HPLC-SEC or SEC-HPLC sequences have been discussed in detail by van der Horst et al.10
At present, standard 2D-LC procedures and instruments are limited to separation at ambient temperatures,11 and therefore cannot be applied to the characterization of semicrystalline polyolefins. This paper describes the coupling of the interactive HT-HPLC system developed by the authors’ group with SEC, and application of HT-2D-LC for the characterization of commercial functional polyolefins.
Experimental
Polymers and solvents
1,2,4-Trichlorobenzene (TCB) and cyclohexanone (Merck, Darmstadt, Germany) were used as components of the mobile phase. The polymer samples were dissolved in TCB at a concentration of 3 mg/mL at a temperature of 140 °C; 200 μL of the sample solutions was injected and analyzed by 2D-LC.
EVA copolymers were products of Bayer (Leverkusen, Germany). Polystyrene standards (PS) with weight-average molar masses (Mw) in the range 0.687–2570 kg/mol (polydispersity index between 1.02 and 1.07) as well as polyvinyl acetate (PVAc) (Mw = 37 kg/mol) were obtained from Polymer Standards Service (Mainz, Germany).
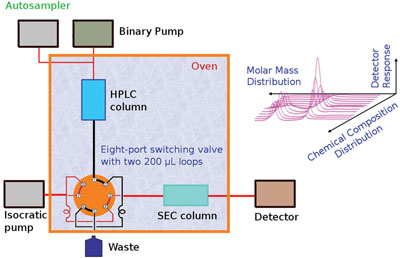
Figure 1 - HT-2D-LC schematic.
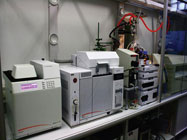
Figure 2 - Photograph of the HT-2D-LC system.
Instrumentation
Separations were achieved on a prototype system for high-temperature two-dimensional chromatography, constructed by Polymer Char (Valencia, Spain). The system consisted of an autosampler, two column ovens, valves, and two pumps (Agilent, Waldbronn, Germany). A binary gradient pump was used for the HPLC analysis and an isocratic pump was used for SEC. Figure 1 is a schematic of the 2D-LC instrument; a photograph of the system is presented in Figure 2.
Separations in the first dimension were carried out on a silica gel Nucleosil 500 column with the following parameters: column size 250 × 4.5 mm i.d., and average particle size diameter 5 μm (MZ Analysentechnik, Mainz, Germany). TCB and cyclohexanone were used as the components of the mobile phase with a flow rate of 0.1 mL/min.
A PL Rapide H column, 150 × 7.5 mm (Polymer Laboratories, Church Stretton, U.K.), was used in the second dimension (SEC). TCB was used as the mobile phase in the SEC column at a flow rate of 2.5 mL/min. A calibration curve for that column was obtained with 11 polystyrene standards at a flow rate of 2.5 mL/min. The temperature of the autosampler and both column ovens was set to 140 °C.
The HPLC and SEC columns were connected via an electronically controlled eight-port valve system (VICI Valco Instruments, Houston, TX) with two 200-μL loops. From the moment of injection into the HPLC column, the eight-port valve was switched every 2 min in order to inject 200 μL of effluent from the HPLC column into the SEC column.
An evaporative light scattering detector (ELSD, model PL-ELS 1000, Polymer Laboratories) was used for detection after the SEC. The ELSD was operated at a nebulization temperature of 140 °C, an evaporation temperature of 260 °C, and an airflow of 1.5 L/min.
2D-LC system handling was done with software provided by Polymer Char. WinGPC-software (Polymer Standards Service) was used for data acquisition and construction of 2-D contour plots.
Results and discussion
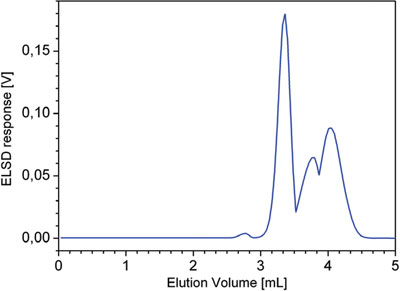
Figure 3 - Chromatogram corresponding to the SEC separation of the mixture of five polymers: PE (Mw = 1.18 kg/mol), PVAc (Mw = 37 kg/mol), and EVAs (19, 45, and 80 wt% VA, respectively). Experimental conditions described in the text.
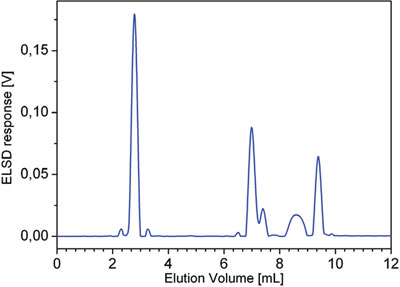
Figure 4 - Chromatogram obtained from the HPLC separation of the mixture of five polymers: PE (Mw = 1.18 kg/mol), PVAc (Mw = 37 kg/ mol), and EVAs (19, 45, and 80 wt% VA, respectively). Experimental conditions described in the text.
For the separation of commercial EVAs according to chemical composition, a sorbent/solvent system developed in the authors’ laboratory7 was applied that separates the EVA macromolecules with regard to their content of the polar comonomer. The polar copolymers were first fully adsorbed on silica gel from TCB and subsequently desorbed according to their comonomer content by applying a gradient of cyclohexanone.7 A blend of five components, including the PVAc, polyethylene (PE), and three EVA copolymers varying in their average VA content, was prepared. The chromatogram in SEC and HPLC are shown in Figures 3 and 4.
SEC shows a multimodal distribution, but it is not possible to recognize that the number of components as macromolecules with different chemical composition coelute in SEC (Figure 3). No information about the MMD of macromolecules with different chemical composition can be obtained from the HPLC chromatogram alone (Figure 4).
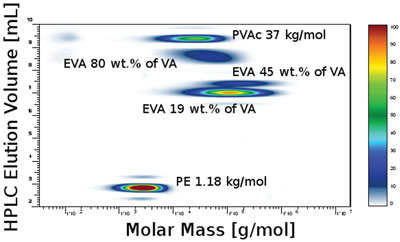
Figure 5 - HT-2D-LC separation of the mixture of five polymers: PE (Mw = 1.18 kg/mol), PVAc (Mw = 37 kg/mol), and EVAs (19, 45, and 80 wt% VA, respectively). Experimental conditions described in the text.
To study the chemical heterogeneity interrelationship, HT-HPLC must be hyphenated to SEC. On-line hyphenation of HT-HPLC and HT-SEC was achieved in the 2D-LC instrument, in which both chromatographic modes were connected on-line by an electronically controlled eight-port valve system equipped with two 200-μL loops. The two loops were used alternately in the symmetrical configuration to store the effluent from the first-dimension column and to subsequently inject it into the second-dimension column. While one sample fraction from the first dimension was being injected and analyzed from one loop, the next sample fraction was being loaded in the second loop. The concentration of the effluent from the SEC column was monitored by the ELSD, and a contour plot was constructed from the data obtained. Figure 5 shows the contour plot of the 2D-LC separation of a mixture, where the separation according to chemical composition is represented along the y-axis; the elution along the x-axis corresponds to the SEC separation.
As can be seen, the different samples eluted in order of increasing polarity. The contour plot clearly shows five spots corresponding to the five components. The first component—polyethylene—eluted before a void volume (the volume of nonretained component) of the system in SEC mode. The next set of components was found in the TCB–cyclohexanone gradient between 6.2 mL and 12.2 mL. The samples eluted in order of their increasing polarity (i.e., VA content), and therefore could be assigned to EVA copolymers. The last eluting component is the most polar, i.e., polyvinyl acetate. The differences in molar mass distribution as well as chemical composition distribution can be seen.
Conclusion
Separation of EVA copolymers by HT-2D-LC was realized for the first time. The basis of the interactive separation is adsorption of polar comonomers from a nonpolar solvent on a silica gel and subsequent desorption by addition of a polar solvent to the mobile phase. The HPLC system separates samples according to their polarity, i.e., chemical composition. Each fraction from the HPLC column was separated in the SEC column. Both chromatographic separations were achieved at a temperature of 140 °C, which is required to keep all analyzed polymer components in a solution. The contour plot obtained represents the distribution of the chemical composition as well as the molar mass distribution of the commercial copolymers. Both distributions were obtained simultaneously in a relatively short time—5 hr for a complete 2D-LC analysis, including sample preparation. In addition to the copolymers, homopolymers and other components may be separated and visualized. Two-dimensional liquid chromatography is experimentally more demanding than other chromatographic techniques. However, the complete characterization yields qualitatively new information about the polymer material, and results can be presented in an impressively simple way.
References
- Kaminsky, W. Macromol. Chem. Phys. 2008, 209, 459–66.
- Yanjarappa, M.J.; Sivaram, S. Progress Polym. Sci. 2002, 27, 1347–98.
- Flory, P.J. J. Chem. Phys. 1949, 17, 223–40.
- Wild, L. Adv. Polym. Sci. 1991, 98, 1.
- Ortin, A.; Monrabal, B.; Sancho-Tello, J. Macromol. Symp. 2007, 257, 13–28.
- Pasch, H.; Trathnigg, B. HPLC of Polymers; Springer: Berlin, 1997.
- Albrecht, A.; Brüll, R.; Macko, T.; Pasch, H. Macromolecules 2007, 40, 5545–51.
- Albrecht, A.; Brüll, R.; Macko, T; Sinha, P.; Pasch, H. Macromol. Chem. Phys. 2008, 209, 1909–19.
- Albrecht, A.; Brüll, R.; Macko, T.; Malz, F.; Pasch, H. Macromol. Chem. Phys. 2009, 210, 1319–30.
- van der Horst, A.; Schoenmakers, P.J. J. Chromatogr. A 2003, 1000, 693–709.
- Cohen, S.A.; Schure, M.R., Eds., Multidimensional Liquid Chromatography: Theory and Applications in Industrial Chemistry and the Life Sciences; Wiley & Sons: New York, NY, 2008.
Mr. Ginzburg is a Ph.D. student; Dr. Macko is a Research Co-Worker; and Dr. Brüll is a Deputy Manager of the Analytical Department in the Department of Analytics, German Institute for Polymers, Schlossgartenstr. 6, 64289 Darmstadt, Germany; tel.: +49 6151 162035; fax: +49 6151 292855; e-mail: RBrü[email protected]. Mr. Ginzburg and Dr. Macko are also with the Dutch Polymer Institute, Eindhoven, The Netherlands. This project forms part of the Dutch Polymer Institute (DPI) project no. 642/643. The authors thank Mr. Alberto Ortin, Mr. Juan Sancho-Tello, and Dr. Benjamin Monrabal (Polymer Char, Valencia, Spain) for valuable discussions and technical support.