Improvements in the price–performance ratio of digital imaging cameras coupled with better data processing tools have promoted the use of “machine vision.” Imaging systems operating in the visible (400–700 nm) and more recently the infrared (3–5 or 8–12 μm) regions are now used commercially for a range of product inspection, quality control, quality assurance, and manufacturing automation applications. The intermediate, near-infrared (NIR) spectral region (1000–2500 nm) has not yet been commercially exploited to the same extent, despite the widely recognized value of NIR spectroscopy as an analytical tool. This situation is changing with the advent of powerful NIR-chemical imaging (NIR-CI) systems that offer unique advantages for many applications.
One sector already reaping the benefits is the pharmaceutical industry. Here the requirements for greater manufacturing efficiency, faster reformulation and product development, and effective strategies for counterfeit detection are fueling the demand for powerful and relevant analytical technologies. NIR-CI is proving to be an extremely useful option.

Figure 1 - NIR chemical image of cold remedy tablets produced by different manufacturers.
With NIR-CI, tens of thousands of NIR spectra are collected in every measurement, each relating to a specific area or pixel across the surface of a sample. The net result is spatially resolved information about the nature and quantity of chemical species in a sample,1 rather than a single averaged measurement (conventional NIR spectroscopy). The raw data are processed using many of the principles developed for single-point NIR, in combination with powerful, user-friendly software that greatly simplifies the application of the technique. Such software makes it straightforward to extract both chemical and morphological information from the measured spectra. Figure 1 shows the types of images that are generated. The two samples are over-the-counter cold remedies, one a generic (left) version of the original (right).
Because NIR-CI locates chemical species within a sample, it is ideal for the study of heterogeneity, as this example shows. The software automatically generates an image by assigning a color—red, blue, or green—to each of three principal ingredients in the formulation. From a visual inspection it is clear that while the formulation of the two samples may be very similar, the original product is much more homogeneous than the generic, which has relatively large domains of unblended material.
This is a simple qualitative assessment of heterogeneity, but with statistical analysis NIR-CI can produce quantitative information about chemical concentration gradients and/or the sizes of the individual chemical domains. These data are usually presented in the form of histograms, scatterplots, and numerical tables, among others. For pharmaceutical products, which are often supplied as solid dosage forms, homogeneous distribution of the active ingredient can be an important processing goal. For many products heterogeneity tends to have a negative impact on dose uniformity, but more specifically the particle or domain size of active pharmaceutical ingredient (API)-rich areas can affect critical parameters such as dissolution rate.
The development of complex products with sustained drug release profiles demands an even greater level of understanding and control. Other chemical/morphological features also lend themselves to investigation by NIR-CI, which provides quantitative measures of, for example, coating thickness uniformity, chemical gradients within a sample, and the association/aggregation characteristics of different species in a blend.
NIR-CI is a rapid, nondestructive technique with measurement times in the order of just a few minutes. Furthermore, modern commercial systems:
- Employ simple and robust light sources, quartz lamps, utilized for many visible imaging applications
- Use simple optics that make it easy to switch between micro- (<100 μm per pixel) and macro- (>100 μm per pixel) scale imaging, on the same instrument
- Offer great flexibility in the type, shape, color, and size of samples that can be analyzed; powders, granules, tablets (round and flat surface), and even complete blister packs can all be imaged
- Require no sample preparation
- Can be fully automated to provide pushbutton measurement, an important feature for routine analytical or high-throughput applications.
The following examples demonstrate the practical relevance of NIR-CI for the pharmaceutical industry and the value of many of these features.
Counterfeit products are a major and growing problem for the pharmaceutical industry. They present a serious health threat to the general population and have significant financial and reputation implications for the industry. Counterfeit detection is a substantial activity within the sector.

Figure 2 - Images of an adulterated blister pack of pharmaceutical tablets.
A fake product may contain no active ingredient, the wrong active ingredient, or the correct active ingredient in the wrong concentration or form or in an unsuitably structured dose. Images of an adulterated blister pack are shown in Figure 2. The image on the left was taken with a conventional visible imaging system, while the one on the right is a processed image from an NIR-CI system.
These data were captured in a single measurement. The unfit tablet is easily detectable; thus a genuine/fake classification is provided in just a few minutes. If this is the sole intention, then measurement times can be reduced by an order of magnitude by focusing on just a few key wavelengths that characterize the product. Furthermore, because of the large field of view, it is possible to simultaneously image a sample of suspect tablets alongside a genuine sample, as a built-in calibration.2 These techniques, coupled with automation, deliver real-time screening, the greater magnification of the instrument being available for further investigation of an uncovered fake.
Sometimes the differences between a counterfeit and a genuine product can be quite subtle, undetectable by conventional analytical techniques, which may also be time-consuming and/or destructive. If overall composition is similar, for example, as with the two cold remedies above, then an analysis that gives averaged results for the complete tablet will detect no difference. Since chemical imaging essentially provides a fingerprint of the product, it differentiates much more sensitively and is therefore a valuable tool for counterfeit detection.
Dose uniformity
Breaking a higher dose tablet into two, rather than purchasing a greater number of low-dose tablets, is a cost-effective measure for consumers. The practice is growing, and is unlikely to prove problematic if the basic assumption that the two halves contain the same amount of API holds true. This is an assumption not routinely tested by a manufacturer releasing tablets on the basis of weight and API content for the whole tablet. For patients using tablets in this way, gross heterogeneity may compromise dose uniformity, a phenomenon particularly important with high-potency low-dosage products.
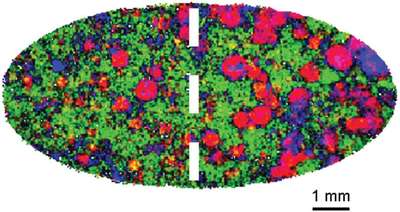
Figure 3 - NIR chemical image representation showing API (shown in red) distribution in a tablet.
An NIR chemical image representation of a single tablet is shown in Figure 3. API is shown in red.1 This surface image shows that API is clearly not distributed evenly through the tablet; therefore a consumer who elected to split it would receive very different doses on subsequent days. The entire tablet could be imaged to evaluate the 3-D distribution of this component and establish if the two halves indeed contain significantly different doses. Drug distribution is readily examined and quantified using chemical imaging, but is completely unknown from the destructive, averaging analytical methodologies often employed by the industry.
These examples clearly highlight the capabilities and value of NIR-CI. Chemical imaging can provide information that conventional analysis does not deliver—not simply what or how much of an ingredient there is in a sample, but where it is located. For pharmaceutical products, structure often directly impacts performance criteria such as bioavailability and dissolution rate; thus this information can be critical, especially in the development of new, more complex drug delivery systems.
A particularly attractive feature of the technique is its ability to capture images at different magnifications. It is simple to switch between micro- and macro-imaging with the same instrument so that either complete blister packs or individual granules can be studied, depending on the application. In this article, the focus has been on applications within the pharmaceutical industry, but the technique is equally applicable and already being used to solve problems in the food, polymer, personal care, chemical, and household product industries.
References
- Lewis, E.N.; Dubois, J.; Kidder, L.H.; Haber, K.S. Near-infrared chemical imaging: beyond the pictures. In Techniques and Applications of Hyperspectral Image Analysis; Geladi, P.; Grahn, H., Eds.; John Wiley and Sons: Chichester, U.K., 2007; pp 335–61.
- Dubois, J.; Wolff, J.-C.; Warrack, J.K.; Schoppelrei, J.W.; Lewis, E.N. NIR chemical imaging for counterfeit pharmaceutical products analysis. Spectroscopy 2007, 22(2), 40–50.
Dr. Lewis is Chief Technology Officer, and Dr. Dubois is Product Manager Americas, Analytical Imaging, Malvern Instruments Inc., 117 Flanders Rd., Westborough, MA 01581-1042, U.S.A.; tel.: 508-768-6400; fax: 508-768-6403; e-mail: [email protected].