Working on the Global NIR ID (Identification) Project, the author needed a way to create a user-friendly, straightforward, easy-to-follow, procedurally driven software application that could be used to perform the functions of his role in the development, validation, and maintenance of the FT-NIR material discriminators at Perrigo (Allegan, MI). With the company receiving well over 500 raw materials approved for use, it had to find a way to identify raw materials in an efficient manner that was equivalent to or exceeded the quality of current compendial identification methods. NIR ID was selected using the ABB Bomem (Quebec, Canada) MB-160 series (now FTLA-2000-160 series) and the Advanced Infra Red (AIRS) software (DHC Analysis Inc., Cleveland, OH).
Individual discriminate-partial least squares (D-PLS) models were employed to reduce or eliminate the probability of a material falsely passing (beta-error) as another material. Furthermore, the confirmation configuration selection aspect of the AIRS software allowed for an easy-to-assess mode of failing in case a multiple ID or beta-error were to occur.
Discussion
Originally, a Microsoft® Excel™ (Redmond, WA) spreadsheet was created for use in developing the methods. A PLS_Toolbox (Eigenvector Research Inc., Wenatchee, WA)-generated dendrogram was applied to determine the nontarget material using a large spectral data set of various materials in different presentations being used, i.e., glass vial, fiber optic probe, and polyethylene bag. This dendrogram approach was also being used with the target and nontarget set manually with highlighter, pen, and paper to determine which samples went into calibration (CAL), tolerance limit determination (TI), validation target (VAL_T), and validation nontarget (VAL_NT) sets. The dendrogram nodes were highlighted based on a color-coding scheme relating to the set along with the same color used to highlight the corresponding Excel spreadsheet record. Each associated spectra file was copied one by one to its corresponding CAL, TI, VAL_T, and VAL_NT set folder in a slow and inefficient manner. The manual process was time-consuming and inadequate for the company’s needs, especially once the volume of spectra for the method exceeded 100.

Figure 1 - Example of default DCC version 3.0 GUI.
MATLAB® (The MathWorks™, Natick, MA) was proposed as a platform due to its ease and streamlined approach in the development of a standalone application that employed complex mathematical functions. The use of MATLAB was further reinforced since PLS_Toolbox was already being used to create the dendrogram and the author had experience developing, validating, and implementing another application for the validation of the D-PLS methods named Discrimination Calculator Companion (DCC, see Figure 1), among other applications.

Figure 2 - Example of default DCC Assistant version 1.0 GUI.
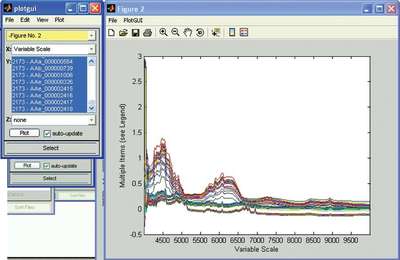
Figure 3 - Example of spectral region selection using plot GUI and displayed in figure overlaid with DCC Assistant version 1.0.

Figure 4 - Example of spectral region selection using plot GUI and displayed in figure with DCC Assistant version 1.0.
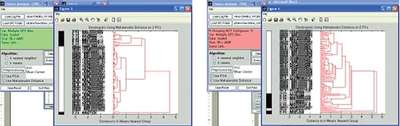
Figure 5 - Example of two executed analyses with dendrogram results noting contiguous clustering of target set using two PCs (with green background) and a grouping that is not contiguous using five PCs (with red background).

Figure 6 - Example of DCC Assistant output showing the main folder-naming convention, subset subfolder-naming convention, data set log file-naming convention, and excerpt of data set log file.
The standalone application for use in sorting, copying, and managing spectra was appropriately named DCC Assistant (see Figure 2). The application was named for its ability to perform the tasks of, at that time, one or sometimes multiple assistants. DCC Assistant was developed using PLS_Toolbox to review (Figure 3), preprocess (Figure 4), and select (Figure 5) spectral regions, then sort and copy the spectra files into CAL, TI, VAL_T, and VAL_NT sets (Figure 6) based on predetermined settings and the resulting cumulative variance. This resulted in an easy-to-manage folder that contains a data set log file and subfolders of the spectra sets (Figure 6).
Much of the functionality of the PLS_Toolbox cluster analysis tool was preserved, although some preprocessing, plots, and other functionality was removed relative to the standalone Solo™ data-analsis product of Eigenvector Research. Further improvements were made to the searching, sorting, and copying operations—a new database was created to store all the spectra file records collected during development, along with a better understanding of how to generate array basic programs using GRAMS/AI.
The new application’s goal was to better control all the different applications developed thus far, i.e., DCC, Discrimination Calculator, DCC Assistant, Preprocessor, and Archiver. Another goal was to allow user selection of other chemometric-related applications that could be executed with a push of a button all on the same dashboard. This database-driven application was developed using Microsoft Visual Studio and GRAMS/AI (Thermo Fisher Scientific, Waltham, MA) and is currently named Mission Control. Mission Control contains a fairly elaborate graphical user interface (GUI) for use in querying the spectral database records based on a target field and nontarget field material number or material name. The material name can be entered in part or in whole.
Additional functionality was later added to include generation of an Excel spreadsheet of the query results, copying of the files queried; preprocessing of the spectra files based on preprocessing settings; and launching of the next application in the suite, i.e., DCC Assistant for sorting of the spectra into CAL, TI, VAL_T, and VAL_ NT folders; GRAMS/AI to build the model; DC for the batch processing of the spectra through a selected model; and DCC for the determination of the pass/fail limits as well as validation of the model, preprocessing, and limits. Most recently, 21 CFR 11 requirements were addressed with the addition of a Windows-based log-in that utilizes the Windows user log-in and password so that the operator is not required to remember additional passwords, and an audit trail to record certain major events.
Results
Mission Control version 1.0 was the end result of these development efforts. As noted above, Mission Control contains a very simple user log-in that validates users based on their Windows log-in. Once logged in, Mission Control contains an easy-to-use dashboard of all the applications employed for the development and validation of NIR ID methods as discussed above and summarized below.
Mission Control version 1.0 features:
- Standalone application for spectra file searching, sorting, copying, and life cycle management
- Searching by target and nontarget material number or name
- Automated sorting and copying of spectra by sample presentation, target, and nontarget materials with a log of the process
- Aiding in life cycle management
- Dashboard design with toolbox to execute user-configured applications.
DCC Assistant version 1.0 offers:
- Standalone application
- Input of spectra log file and spectra
- Preprocessing options
- K-Value, PCA, and Mahalonobis Distance options
- Interactive plot GUI
- Automated sorting of spectra
- Output of spectra log file and spectra sorted into CAL, TI, VAL_T, and VAL_NT folders.
Features of DCC version 3.0 include:
- Standalone application
- Calculation of tolerance interval limits
- Determination of probability of a false positive
- Output of limits and time-/date-stamped reports for calculation and determinations performed.
The result is virtually no multiple ID or beta-error; reduced if not eliminated alpha-error; significantly reduced development time; validation that is specific, robust, and repeatable; over 150 material discriminators deployed globally; and centralized Global NIR ID method management.
Conclusion
Further work can be done to improve 21 CFR 11 compliance of the application so that all major events and actions will be sequentially appended to an encrypted audit trail. Keeping in mind that the majority of the tools in the suite are used for method development, those tools used for method validation are validated.
The novel tools within Mission Control have empowered users to single-handedly develop individual D-PLS methods utilizing hundreds of thousands of spectra available where initially anything over 100 spectra became overwhelming. Mission Control performs many of the development, validation, and maintenance tasks of the FT-NIR material discriminators. The rate of production of individual D-PLS methods has increased significantly at Perrigo from a handful per year to a handful per day in some cases, i.e., if a full day can be dedicated to working exclusively on NIR ID project-related work.
Mr. Finch is Sr. QC Chemist, Perrigo, 500 Eastern Ave., Allegan, MI 49010, U.S.A.; tel.: 269-673-1491; e-mail: [email protected].