The use of polymer laminates is widespread, and their structure and composition vary greatly. Individual layer thickness can range from less than 4 μm to many tens of micrometers or more. Transmission infrared microscopy is an excellent tool for the study of these materials, and is widely employed. Attenuated total reflectance (ATR) imaging is a relatively new technique offering advantages over IR imaging methods, and is poised to become highly useful for laminates studies. For successful IR microscopy, it is necessary to cut the samples into thin sections (~10-μm thickness). This is not always straightforward, and maintaining integrity of the sample can be difficult. In addition, the presence of a sample of finite thickness in a highly converging IR beam can limit spatial resolution1 regardless of the hardware used.
ATR imaging can overcome some of these limitations and resolve detail that is difficult, if not impossible, to observe using conventional IR microscopes. As a reflectance technique, the sample need not be cut into thin cross-sections but is typically mounted in an embedding resin and polished to a flat surface. Also, the depth of sample interrogated by the IR beam is relatively low: approximately 1–2 μm using germanium ATR crystals. Images tend to be sharper and spectra show fewer artifacts due to beam divergence1 and interference fringes. Additionally, ATR imaging can provide data with higher spatial resolution than transmission imaging.2 A resolution of less than 4 μm is achievable with ATR, whereas the physical diffraction limit for transmission work is typically 3–4 times this figure in the midinfrared fingerprint region.
An ATR imaging accessory has been developed for the Spotlight™ imaging system (PerkinElmer Life and Analytical Sciences, Shelton, CT) that can deliver these advantages.2 The device uses a germanium cone that is pressed against the cross-section of the laminate. The relatively large tip diameter of ca. 500 µm usually allows the entire laminate structure to be analyzed using a single contact with the sample. With other devices using much smaller active areas, multiple impressions into the sample would be needed.
This article describes use of the ATR imaging accessory to measure polymer laminate samples, showing the level of detail that can be routinely revealed, along with some practical measurement considerations.
Experimental
To obtain good ATR images, the sample must be brought into direct, uniform contact with the crystal across the entire measurement area. To achieve this, the laminate needs to have a flat surface at the point of contact, and be adequately supported to avoid distortion under pressure. The polished resin sample block is placed directly on an anvil on the ATR accessory; the anvil is raised to bring the sample into firm contact with the crystal. Using the embedding technique, there is of course some risk of spectral interference from the resin in the images, but in practice, provided the materials are chemically distinct, this rarely creates a problem in the subsequent data analysis.
The Spotlight system typically runs with scan conditions between 1 and 16 scans per pixel with a spectral resolution of 4–16 cm–1. The data collection software allows rectangular image areas of various aspect ratios to be defined—a useful advantage of using small linear detector arrays, particularly for scanning across a long, thin laminate sample. Image collection times are usually a few minutes, depending on conditions selected.
Results
Example 1: Packaging material
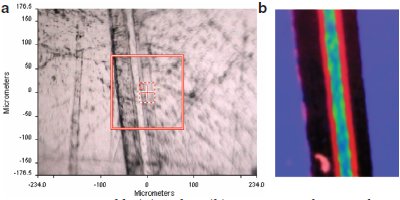
Figure 1 - Visible (a) and IR (b) reconstructed images from embedded laminate.
Figure 1a shows the visible image of a packaging material section, embedded in epoxy resin. Despite the surface scratches, it was possible to generate good ATR images because the sample was slightly compliant, allowing the crystal tip to be pushed into it. Appropriate data treatment can minimize the effects of the slightly varying contact across the image. Figure 1b shows the reconstructed IR image, in which the scratches are no longer apparent.
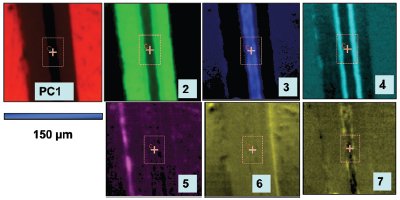
Figure 2 - Principal component score images.
To obtain the reconstructed image, the image spectra were derivatized, offset-corrected, and subject to principal components analysis (PCA). This technique sorts the image spectra into an independent set of subspectra (principal components) from which the image spectra can be reconstructed. For example, if there are five layers present in an image of, say, 1000 spectra, then five subspectra would be sufficient to describe all the 1000 image spectra. In practice, more than five spectra are usually required due to the presence of impurities and other spectral contributions such as variations in baseline and atmospheric absorptions. The amounts of the principal components in the original image spectra, or scores, are calculated at each pixel, and the resulting score images are extremely useful in enhancing IR image contrast. For this sample, the first seven PC score images are shown in Figure 2. Here, the major layers are accentuated using PCA, along with some minor, more subtle features, which will be described. The first score image, PC1, is due to the embedding medium.
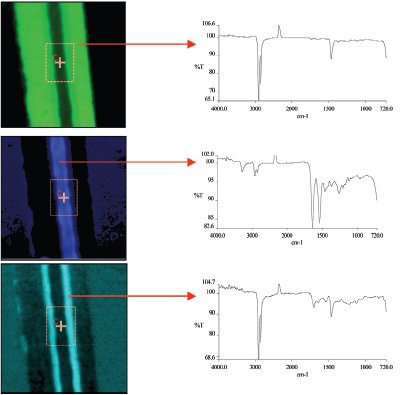
Figure 3 - Score images for PC2, PC3, and PC4.
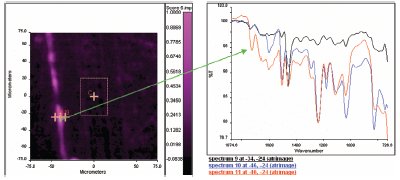
Figure 4 - Score image for PC5.
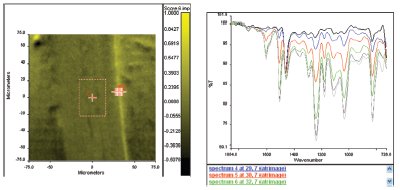
Figure 5 - Score image for PC6.
The second and third PC score images show the major laminate layers, a polyethylene (PE) and polyamide (PA) (Figure 3) with intermediate layers approximately 6 μm in thickness, sandwiched by the PE and PA, as revealed in the PC4 image. Here, the layers are readily identified by examination of the underlying raw image pixel spectra. In addition, the features due to the minor variance are shown in the PC5 and PC6 score images (Figures 4 and 5). The PC5 ima g e shows a feature 3–4 μm thick, close to the outer edge of the sample. Using the Spotlight Overlay Manager software, it is possible to view the raw spectra underlying these features, tracking through the feature at steps of 1.56 μm. In the layer itself, there are unique carbonyl features in the spectra that are not present on either side of the layer, thus confirming the distinct chemical composition of the layer. This can be compared with the situation in Figure 5, where the PC score image also reveals a layer. However, no distinct chemical feature appears on examination of the spectra throughout the layer, rather a relatively smooth gradation in spectral intensity from one material to the next. This indicates a physical boundary, such as a ridge, rather than a distinct chemical constituent.
Example 2: Revealing fine detail
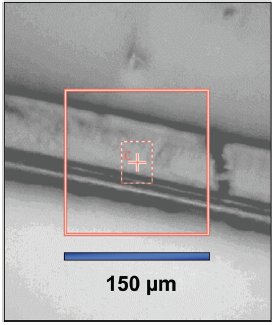
Figure 6 Visible image of laminate with thin adhesive layer.
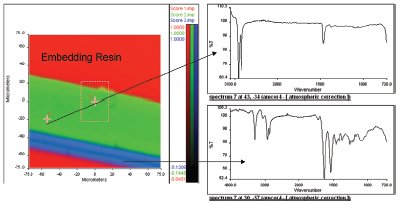
Figure 7 - First three principal component score images overlaid.
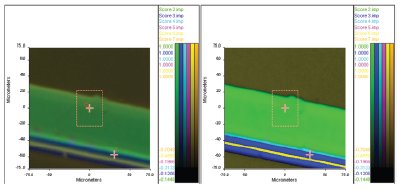
Figure 8 - Use of color overlay options to enhance detail.
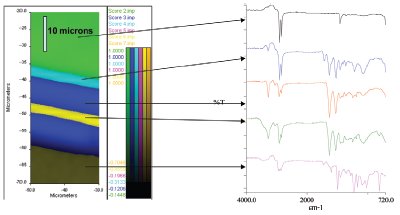
Figure 9 - Spectra from individual layers.
This example shows a laminated film with intermediate layers of less than 5 μm in thickness. The ATR image was collected over a 150 × 150 μm area using spectral resolution of 8 cm–1. Figure 6 shows the visible image of the sample with the ATR image area highlighted by the red boundary. The image was analyzed using PCA as before (Figure 7). Of interest in this example was the layer structure immediately below a thick polyethylene layer, where more than three chemical constituents are present. With three or fewer components, using a simple red/green/blue representation to view the combined image works well with the human eye. But attempting to show more than three components/colors in such an overlaid image can lead to problems when there is overlap between constituents. The Overlay Manager function in the Spotlight system defines the rules for displaying pixels where overlap occurs, and used in conjunction with examination of the underlying spectra, can be very useful in enhancing contrast. Figure 8 shows the resulting score composite image: The first image (a) is shown with colors averaged in regions of overlap, and the second (b) is shown with the pixel colors set by the most intense component in overlap regions. The improvement is quite striking, and overlaying the color-enhanced image with the raw data confirms that real chemical differences are observed within the different-colored regions (Figure 9).
Conclusion
With these examples, the sample embedding technique works well, with little sample degradation. When information on the film constituents is not available, PCA can be useful for analyzing survey images and helps reveal fine image structure. It is advisable, however, to view the derived score images with the raw data to verify the basis for the calculated image structure, since the PCA can discern physical and morphological structure in the sample, as well as chemical differences. For presentation of calculated images, it is worthwhile to consider options for displaying pixels in overlap regions.
The ATR imaging technique adds a number of benefits compared with transmission IR imaging for polymer laminates. In addition to simpler sample presentation and fewer spectral artifacts, ATR imaging can provide improved spatial resolution. Individual layers, such as adhesives, of 4 μm or less, can be readily identified. As such, use of the technique is likely to grow significantly in the future.
References
- Sommer, A.J. Mid-infrared transmission microspectroscopy. In: Handbook of Vibrational Spectroscopy; Wiley: New York, 2002; 2, 1369.
- Canas, A.; Carter, R.; Hoult, R.; Sellors, J.; Williams, S. Spatial resolution in mid-IR ATR imaging: measurement and meaning. FACCS Conference, FL, 2006.
Dr. Sellors is IR Technology Manager, PerkinElmer Life and Analytical Sciences, 710 Bridgeport Ave., Shelton, CT 06484, U.S.A.; tel.: 203-925-4602; e-mail: [email protected].