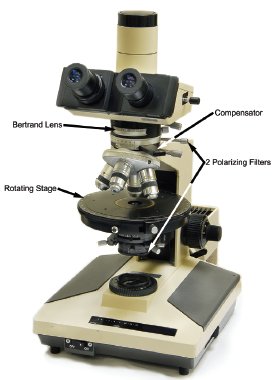
Figure 1 - Polarized light microscope (PLM) with important components indicated with arrows.
The polarized light microscope (PLM) is an extremely powerful instrument for the analysis of many chemical systems. A PLM is a compound light microscope with a small number of additional components, including two polarizing filters, a compensator, a Bertrand lens, and a rotating stage (Figure 1). Equipped with these accessories, a simple light microscope becomes capable of providing information about the chemistry and structure of a material, as well as its morphology.
Much of the early knowledge of crystalline solids, liquid crystals, polymers, and electromagnetic radiation can be attributed to observations made with the PLM. The structures of the various liquid crystalline phases were originally characterized and described with the assistance of the PLM,1 and the PLM is still used today to study these unique materials.2 The crystal systems and symmetry of numerous substances were determined,3,4 and optical activity was discovered and explained with the aid of this instrument.5 These are but a few examples of the significant historical contributions the PLM has made to chemistry during the past two centuries. In light of these contributions, it is difficult to understand why it is so rarely found in modern chemistry laboratories.
It is likely that the decline of the use of the PLM can be attributed to the development of more recent techniques and instruments such as X-ray diffraction, electron microscopes with X-ray spectroscopy, mass spectrometry, and vibrational spectroscopy. These provide structural and chemical information in a highly automated fashion. This same information is often obtainable by the PLM but requires a high level of training, practice, and a deep understanding of optical crystallography. It is the opinion of the authors that the development of these powerful tools should have, if anything, increased the value of the PLM in the chemistry laboratory. With detailed structural and chemical information, it is now much easier to interpret the observations made with the PLM. Armed with this knowledge, slight changes in structure or chemistry can be interpreted by measuring the resulting changes in optical properties. Modern instrumentation should enable the expansion of the theory behind refractive index, dispersion, and other optical properties so that they provide more specific chemical insights.
The PLM also has the following advantages compared with other instruments: It requires only an extremely small sample; allows information about a material to be rapidly obtained; is inexpensive relative to other instrumental techniques; and is applicable to all classes of materials, such as crystalline substances, amorphous substances, inorganic compounds, and organic compounds. This applicability to various materials is due in part to the properties directly observed by the PLM.
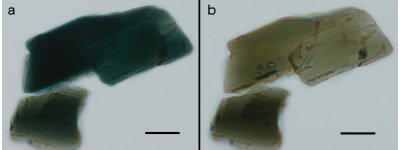
Figure 2 - a) Plane-polarized light image of the mineral hornblende with the polarizing filter oriented east and west, and b) the same particle with the polarizing filter rotated by 90°, showing a different absorption color and refractive index. Scale bar is 100 μm.
The primary characteristics observed with the PLM are optical properties related to refractive index values in a material. The refractive index depends on the electron density and polarizability of the electrons in the substance. Refractive index thus provides useful information about the chemistry and structure of a material, and altering either of them (for example, by changing bond lengths or substituting one chemical species for another) will result in a change in the material’s refractive index (Figure 2). There are comprehensive references that deal with applications of refractometry in chemistry.6 They provide details about atomic, molecular, ionic, and other refractivities of numerous chemical species, making it possible to correlate changes in optical properties with changes in chemistry or structure.
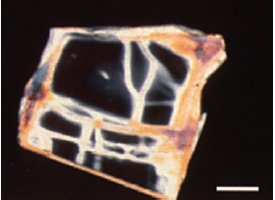
Figure 3 - Natural heulandite in crossed polars showing partial Pb exchange as indicated by increased retardation along the cracks and edges of the grain. Scale bar is 100 μm. (Reprinted with permission from Ref. 7.)
An important potential application of the PLM is in monitoring changes in chemistry and structure as materials undergo catalysis, ligand binding, adsorption, or other reactions. Substances can be examined directly using a PLM while they interact with liquids, with gases, in solution, and so on. One example of this is provided by zeolites used in water treatment. As zeolites undergo lead exchange in water, their optical properties change dramatically. The areas in a single crystal in which lead exchange has taken place appear dramatically different between crossed polars due to the changes in the optical properties of areas that have incorporated lead.7 A great advantage of the PLM for this type of application is that it provides a visual map of where the changes in the material are taking place (Figure 3). If the ions being exchanged are closely spaced along one crystallographic axis and more widely spaced along another, the changes in optical properties will be more dramatic along one axis than the other. This can be quantified by the measurement of refractive indices along the various crystallographic directions or qualitatively monitored in real time as the reaction takes place by observing changes in contrast, dispersion staining color, or retardation. It can be determined whether a change takes place only on the surface of a material, on a particular crystal face (i.e., the (010) face only), or along cracks or fractures in a particle.
Anisotropy of optical properties can be quantified promptly on minute samples. The anisotropy thus measured provides insight into the distribution of electron density in different crystallographic planes within the material and may be correlated to anisotropy of other properties within the substance (thermal expansion, hardness, electrical conductivity, heat conduction, etc.).8 Materials with unique optical properties having applications in, for example, liquid crystal displays, polarized light photoemitters, and pigments can be best appreciated by measuring those optical properties directly using a PLM.
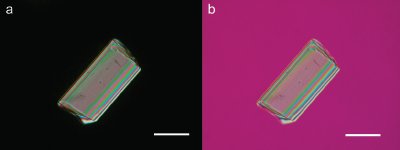
Figure 4 - a) Tourmaline crystal in crossed polars showing high-order interference colors, and b) the same particle with a first-order red compensator; the change in the interference colors indicates that the greatest electron density lies along the width of the crystal. Scale bar is 100 μm.
The purity of a synthetic reaction product can also be assessed instantly using the PLM, with immediate information about the chemical identities of any impurities. If one becomes familiar with the optical properties of compounds likely to be encountered, such as unwanted potential reaction products or unreacted starting materials, these can be recognized in a sample within seconds. The chemist can survey the reaction products and determine whether any of the aforementioned substances have been obtained or whether the examined particles are a new material never before seen. Furthermore, if it is a new material, one can rapidly determine the crystal system and obtain qualitative information about the structure—is it one-, two-, or three-dimensional (i.e., is electron density similar in all directions, similar along two crystallographic axes but dramatically different along the third, or different along all three)? Along which crystallographic axis is the electron density the greatest (Figure 4)? Along which is it the smallest? Crystal morphology, particle size distribution, twinning, aggregation, and the presence of contaminants can all be elucidated.
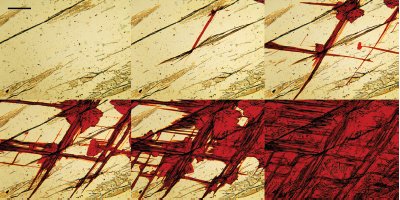
Figure 5 - Series of photomicrographs showing mercuric iodide undergoing a polymorphic transformation from the high-temperature yellow polymorphic form to the low-temperature red polymorphic form on cooling. Scale bar is 200 μm.
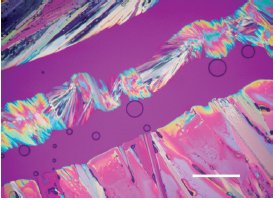
Figure 6 - Image showing (+) pseudoephedrine in the upper left and (–) pseudoephedrine in the lower right with an addition compound formed in the center. Formation of an addition compound indicates that the two enantiomers are different. Scale bar is 200 μm. (Reprinted with permission from Ref. 11.)
With the addition of a hotstage, one can study phase changes at temperatures ranging from –196 °C to 1500 °C. For example, one can observe that a material dehydrates slightly above 100 °C and then in minutes determine how the electron density along the different crystallographic axes has changed. If there are phase changes at several different temperatures, each one can be characterized in a similar fashion. The location and orientation of disordered groups in a crystal structure may be inferred by careful analysis of the optical properties and by comparison with known structures suspected to be similar. Polymorphic transformations (Figure 5),9 the formation of co-crystals (molecular addition compounds), 10 differentiation of enantiomers (Figure 6),11 and many other phenomena can be directly observed and studied using a PLM, making it particularly applicable to current problems facing the pharmaceutical industry.
Summary
Whether it be to monitor subtle changes in chemistry and structure as a substance undergoes some type of reaction, quickly assess a reaction to determine if the desired products have been obtained, study phase changes at different temperatures, or used in a complementary fashion with other instruments to provide further supporting data, the PLM is a critical component to any chemistry laboratory. While modern instrumentation enables chemists to solve problems and obtain extremely diagnostic structural and chemical data, there is some information only obtainable with the PLM. It never hurts to have an additional weapon in one’s arsenal, and this is one that has the potential to be very powerful.
It is the hope of the authors that a greater awareness of this instrument and its applications will lead to its widespread use in chemistry departments, furthering our scientific knowledge.
References
- Hartshorne, N.H. The Microscopy of Liquid Crystals. Microscope Publications, Ltd.: Chicago, IL, 1974.
- Li, L.; Walda, J.; Manna, L.; Alivisatos, A.P. Semiconductor nanorod liquid crystals. NanoLetters 2002, 2(6), 557–60.
- Winchell, A.N.; Winchell, H. The Microscopical Characters of Artificial Inorganic Solid Substances: Optical Properties of Artificial Minerals. McCrone Research Institute: Chicago, IL, 1989.
- Winchell, A.N. The Optical Properties of Organic Compounds. McCrone Research Institute: Chicago, IL, 1987.
- Lowry, T.M. Optical Rotatory Power. Dover Publications: New York, NY, 1964.
- Batsanov, S.S. Refractometry and Chemical Structure. D. Van Nostrand Co., Inc.: Princeton, NJ, 1966.
- Gunter, M. The future of the polarized light microscope: bright, dim or extinct? The Microscope 2003,51(2), 53–63.
- Bloss, F.D. Optical Crystallography. Mineralogical Society of America: Washington, DC, 1999.
- McCrone, W. Fusion Methods in Chemical Microscopy. Interscience Publishers, Inc.: New York, NY, 1957.
- Thayer, A.M. Form and function. Chem. Eng. News June 18, 2007, 17–30.
- Crantz, B. Observations of the mixed fusions of (+) and (–) pseudoephedrine and ephedrine hydrochloride. The Microscope2004, 52(3/4), 119–29.
Mr. Bowen is a Forensic Microscopist, Stoney Forensic, Inc., 2820 S. Michigan Ave., Chicago, IL 60616, U.S.A.; tel.: 312-842-7100; fax: 312-842-1078; e-mail: [email protected]. Mr. Sparenga is a Research Microscopist/Instructor, McCrone Research Institute, Chicago, IL.