Consumption of asparagus has been known to cause a distinct odor in the urine of humans. This odor can be present in urine in as little as 10–15 min after consumption. The compound that is unique to asparagus, and is metabolized into the compounds responsible for the odor, is asparagusic acid. Subjects who consumed asparagusic acid, without consuming asparagus, produced the characteristic odor associated with asparagus consumption. The asparagusic acid is metabolized to S-methyl thioesters1 and ultimately to methanethiol, dimethyl sulfide, dimethyl disulfide, dimethyl sulfone, and dimethyl sulfoxide.2 Traditional extraction techniques have utilized heated solvent extraction, in which the extracting solvent and sample are heated to above body temperature over periods as long as 48 hr for sample preparation.3 In this study, the goals were to eliminate the use of potentially hazardous and environmentally unfriendly solvents, reduce overall extraction time through the use of stir bar sorption extraction (SBSE), and make use of the chromatographic power and analyte identification capability of GC×GC-TOFMS.
Instruments and methods
In this study, measurements were made with a Pegasus 4D GC×GC-TOFMS system (LECO Corp., St. Joseph, MI). The system consists of an Agilent 6890 gas chromatograph (Agilent Technologies, Santa Clara, CA) equipped with a dual-stage, quad-jet thermal modulator (LECO) between the primary and secondary columns and a Pegasus HT time-of-flight mass spectrometer (TOFMS) (LECO) as a detector. For this study, the primary analytical column was a 10.0 m × 0.18 mm i.d. × 0.20 μm df Rtx-5 (Restek, Bellefonte, PA) mounted externally on the GC oven door (MACH LTM, GERSTEL USA, Baltimore, MD). The secondary column was a 1.00 m × 0.10 mm i.d. × 0.10 μm df DB-17ms (Agilent Technologies) and was housed in the GC oven. The modulator temperature offset for this study was +30 °C in relation to the first column temperature. Helium was used as the carrier gas at a constant flow of 1.5 mL/min. The transfer line to the TOFMS consisted of the last 20 cm of the secondary analytical column and was kept at 280 °C. For the one-dimensional study, the modulator was turned off and the GC oven housing the secondary column was maintained isothermally at 280 °C to minimize retention on the second column.
Urine samples of approximately 250 mL were collected prior to consumption of asparagus, and again approximately 90–120 min after consumption of asparagus. The samples were immediately placed in 250-mL amber glass bottles, each containing one 10 mm × 0.5 mm polydimethylsiloxane (PDMS) stir bar and extracted on a stir plate at 800 rpm for between 180 and 240 min. Upon completion of the extraction, the stir bar was removed, rinsed with deionized water to remove any particulates, and placed in a thermal desorption unit (TDU) tube for analysis. The tube containing the stir bar was placed in the MPS 2 multipurpose sampler (GERSTEL) sample tray with the MPS 2 adapter in place on the tube. The MPS 2 then automatically loaded the TDU tube into the TDU. The TDU was then heated, and the analytes desorbed from the stir bar. The analytes were then immediately trapped in the CIS 4 cryogenic inlet system (GERSTEL). The CIS 4 was then heated to desorb the analytes onto the GC column.
The TDU’s initial temperature was 30 °C and was held at this temperature for an equilibration time of 120 sec. It was then heated to 280 °C at a rate of 700 °C/min and held at this temperature for 120 sec. The CIS 4 was cooled to a temperature of –120 °C. It was heated to 280 °C at a rate of 12 °C/sec and held for 120 sec.
Results
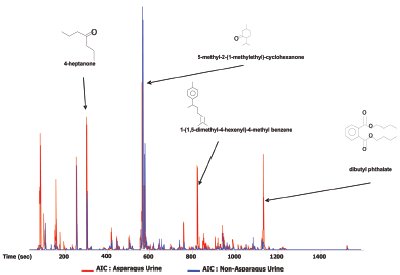
Figure 1 - One-dimensional traces of pre-asparagus and post-asparagus samples overlaid to highlight their differences.
In this study, the urine samples were not derivatized or pretreated before extraction. Analytes of interest in the post-asparagus samples are sulfur containing compounds not present in the pre-asparagus urine samples. In Figure 1, the 1-D traces of pre-asparagus and post-asparagus samples are overlaid to highlight their differences. Table 1 shows a comparison list of compounds of interest in the post-asparagus sample against the pre-asparagus sample.
Table 1 - Comparison of values between pre-asparagus and post-asparagus samples
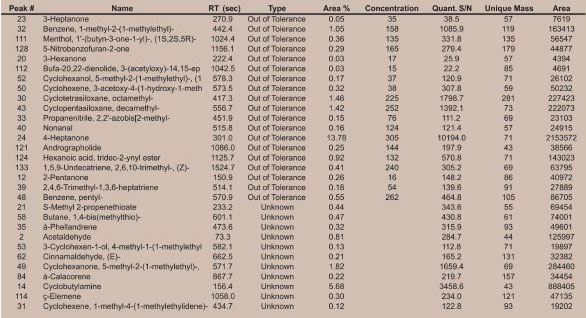
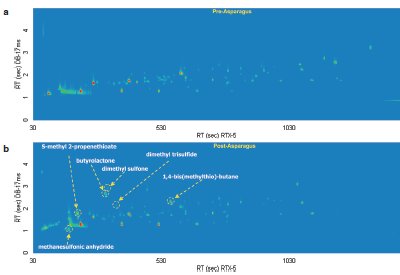
Figure 2 - GC×GC-TOFMS analysis of a) pre-asparagus and b) post-asparagus sample contour plots.
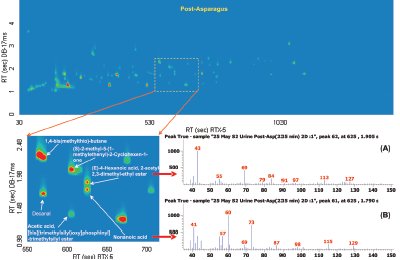
Figure 3 - Post-asparagus sample with three highlighted pairs of analytes that coeluted in 1-D GC but are resolved in GC×GC.
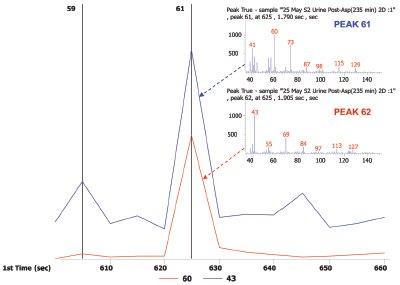
Figure 4 - Peak pair of nonanoic acid and 4-hexenoic acid and 2-acetyl-2,3-dimethyl-ethyl ester shown as a reconstructed 1-D chromatogram of each compound’s quantitative ion, m/z 43 and m/z 60, respectively.
In Figure 1 the most prominent peaks, visible in red, include acetone, acetic anhydride, 4-heptanone, 5-methyl-2-(1-methylethyl)- cyclohexanone, and 1-(1,5-dimethyl-4-hexenyl)-4-methyl benzene. Trace peaks not present in the pre-asparagus sample, but present in the post-asparagus sample, include S-methyl propenethioate and 1,4-bis(methylthio)-butane. The GC×GC-TOFMS analysis of pre-asparagus and post-asparagus sample contour plots is shown in Figure 2. The contour plot shows first column retention time on the x-axis, and second column retention time on the y-axis. Figure 3 shows a post-asparagus sample with three highlighted pairs of analytes that coeluted in 1-D GC but are resolved in GC×GC. They coelute because their retention times on the first column are the same. In GC×GC, peaks also have a retention time on the second column, which is of a different selectivity than that of the first column. The difference in retention times on the second column provides the separation of the previously coeluting pairs on the vertical second-dimension y-axis. The peak pair of nonanoic acid and 4-hexenoic acid and 2-acetyl-2,3-dimethyl-ethyl ester are shown in Figure 4 as a reconstructed one-dimensional chromatogram of each compound’s quantitative ion, m/z 43 and m/z 60, respectively. This reconstructed 1-D chromatogram shows the coelution that would occur. The individual spectra, used to determine their quantitative ions, are also shown.
Conclusion
This study has shown an improvement not only in overall analysis and sample preparation time, but in decreased complexity of sample preparation, as well as elimination of extraction solvents. The automated nature of the MPS 2–TDU–CIS 4 system decreases the amount of labor necessary for each analysis by allowing for automation of the process. The use of GC×GC-TOFMS also enables better resolution of analyte peaks and decreased coelutions through the increased peak capacity and usable chromatographic “real estate” provided by the multidimensional separation. Any remaining coelutions can be resolved through True Signal Deconvolution™ (LECO) made possible by the high-speed, full-range spectra, which are free of spectral skewing, obtained from the TOFMS.
References
- White, R.H. Science1975, 189, 810.
- Waring, R.H.; Mitchell, S.C.; Fenwick, G.R. Xenobiotica1987, 17, 1363.
- Mitchell, S.C. Drug Metabolism and Disposition 2001, 29, 539.
Mr. Stevens is an Applications Chemist, Life Science and Chemical Analysis Centre, LECO Corp., 3000 Lakeview Ave., St. Joseph, MI 49085, U.S.A.; tel.: 269-985-5817; fax: 269-982-8977; e-mail: [email protected]. The author would like to acknowledge the assistance of LECO Corp.’s Life Science and Chemical Analysis Centre and GERSTEL USA’s Applications group (Baltimore, MD).