Both infrared and Raman spectroscopic techniques are useful for probing the structure of complex molecules. However, they are typically not as sensitive as mass spectrometric techniques and hence have not been used widely in applications requiring analysis at or below microgram or parts-per-million levels. Recent developments in the preparation of substrates for signal enhancement of infrared and Raman spectroscopic techniques have extended the range of their practical applications. For Raman spectroscopy in particular, the multitude of substrates for surface-enhanced Raman scattering (SERS) have enabled the analysis of substances from nanogram to picogram levels.1 Substrates based on silver and gold nanoparticles or coatings have been demonstrated for the analysis of amino acids;2 heterocyclic amines such as 9-aminoacridine, 6-mercaptopurine, thiamine, acridine,3 and melamine;4 and endocrine disruptors such as para-aminobenzoic acid, 6-amino-2-naphthoic acid, and terephthalic acid.5
The simplest approach to the preparation of media capable of signal enhancement for SERS analysis is via chemical reduction of the metal salts of silver or gold to form colloids. Reducing agents such as sodium borohydride,6 sodium citrate,7 and hydroxylamine chloride8 have been used. The degree of signal enhancement in SERS has been reported to be in the range of 104–107 for rhodamine 6G and p-aminobenzoic acid.9,10 Compounds with amino, carboxylic, hydroxyl, and sulfhydryl groups have been shown to have a higher enhancement factor in SERS analysis. With a few modifications, as described in this article, surface-enhanced infrared and Raman spectroscopic techniques can be carried out using a common substrate for sample deposition so that the structural identification of analytes at low concentration levels is feasible. Due to the complementary nature of infrared and Raman spectra, the ability to discriminate among closely related structures is superior via the synergistic combination of both methods.
Materials and methods
Silver colloid preparation
SERS-active silver colloids were prepared according to one of the procedures of Leopold and Lendl8 by rapidly mixing 1.11 × 10⁻³M silver nitrate (Fisher Scientific, Suwanee, GA) with a solution containing 1.5 × 10⁻²M hydroxylamine hydrochloride (Baker Chemical Co., Phillipsburg, NJ) and 3.0 × 10⁻²M sodium hydroxide (Fisher Scientific). One type of silver colloid was without chloride and a second was prepared by adding sodium chloride (Fisher Scientific) to give a final NaCl concentration of 8.0 × 10⁻³M in the silver colloid. Freshly prepared silver colloids were preconcentrated fivefold, 25-fold, or 50-fold using an Allegra™ 64R centrifuge (Beckman Coulter, Fullerton, CA) at 3000 rpm and 12 °C for 15 min followed by the removal of excess supernatant.
Analytical conditions
The preconcentrated silver colloid and samples prepared in methanol were mixed at a volume ratio of 1:1, 4:1, or 100:1 directly on substrates followed by drying at ambient conditions prior to Raman analysis. The substrates studied included silicon wafers (Fullam, Inc., Latham, NY), 7 mm × 10 mm copper strip (Fullam), and plastic coverslips (VWR, Inc., West Chester, PA). An HRC-10 Raman spectrometer (EnWave Optronics Inc., Irvine, CA) equipped with a laser excitation wavelength of 785 nm was used for spectral acquisition for a signal integration period of 90 sec. The fiber optic probe of the Raman spectrometer was set at a distance corresponding to a focal length of 6 mm from the sample surface. After the SERS analysis, infrared spectra of the same substrates containing the sample analytes and silver colloid were acquired using a model 7000 FTIR spectrometer (Varian, Inc., Walnut Creek, CA) with a Golden Gate diamond attenuated total reflectance accessory (Specac, Cranston, RI). The infrared spectra were obtained by coadding 32 scans at a spectrometer resolution of 4 cm–1.
Results and discussion

Figure 1 - Comparison of SERS spectra of 0.2% o-mercaptobenzoic acid on plastic coverslips obtained with and without chloride ions in the silver colloids.
The use of a fiber optic probe permits an extremely small sample volume of 2–5 μL to be used for SERS measurement, as demonstrated by the analysis of o-mercaptobenzoic acid (Figure 1) on a microscope coverslip. The use of 1:4 ratio (v/v) of 1% o-mercaptobenzoic acid to 25-fold preconcentrated silver colloid without chloride allowed a strong signal to be obtained for the 0.2% sample. The addition of NaCl further enhanced the signal, thereby enabling spectra of high signal-to-noise ratio to be produced from the analyte at microgram levels. The role of anions in improving the SERS enhancement has been discussed previously,11 and can be used advantageously to boost the chemical effect of signal enhancement in addition to electromagnetic enhancement. The signal enhancement factors at wavenumber 1120.8 cm–1 were about 4500 and 1100 for the SERS analysis with and without chloride, respectively, compared to the normal Raman spectrum. The copper substrate with silver colloid consistently yields the strongest signals for o-mercaptobenzoic and other analytes, and typically improves signals threefold to tenfold relative to both the plastic coverslips and silicon wafers.
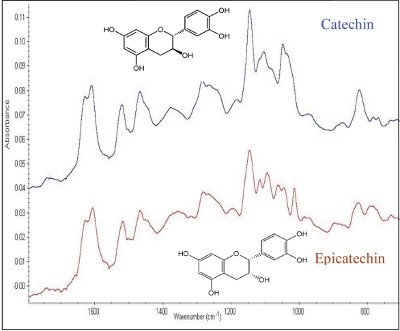
Figure 2 - Comparison of SEIRA spectra of catechin and epicatechin on copper strips. A 1:1 (v/v) ratio of 0.2% analyte to 50-fold preconcentrated silver colloid was used.
The benefit of signal enhancement by using substrates containing silver nanoparticles is also shared by infrared spectroscopy and is commonly referred to as surface-enhanced infrared absorption (SEIRA). Both SEIRA and SERS are complementary techniques and thus it is ideal to develop a substrate that is applicable to both modes of analysis. A simple substrate based on copper surface coated with colloidal silver nanoparticles was found to be suitable for obtaining reproducible infrared and Raman spectra of trace quantities of analytes. The copper substrate was used with the attenuated total reflectance (ATR) accessory to yield SEIRA spectra (Figure 2) of catechin and epicatechin, a pair of flavonoid epimers commonly found in green tea. The stereoisomeric configuration of the nearly identical compounds would have posed a challenge for mass spectrometric elucidation, but their spectra reveal distinguishing characteristics in the 1000–1200 cm–1 and 750–850 cm–1 spectral regions. The spectra are extremely reproducible, as corroborated by the Euclidean spectral match indices of 850–990 for a group of polyphenolic compounds whose spectra were searched against a user-defined infrared spectral library.

The complementary nature of SERS and SEIRA is demonstrated in Figure 3, which shows the spectra obtained by both methods for malvidin at a concentration of 200 ppm. The spectral range in SERS extends down to about 400 cm–1, whereas the SEIRA spectrum can only be acquired down to about 650–700 cm–1 due to the limitation of the spectrometer and ATR optics. The SERS and SEIRA spectra are distinctly different and can be attributed to the different spectroscopic manifestation of the dipole moment and polarizability characteristics of malvidin. The spectral features of SEIRA and SERS spectra are different from their normal infrared and Raman spectra, respectively. The spectral bands observed in both surface-enhanced techniques tend to have significantly higher signal intensities and are usually shifted by 10–50 cm–1 and the bandwidth broadened with loss of fine features of the band. In the examples mentioned above, the adsorption is likely to involve the thiol group in mercaptobenzoic acid and the hydroxyl group in catechin, epicatechin, and malvidin.
The deposition of silver colloids onto copper, silicon, and plastic substrates is simple to prepare and does not use corrosive chemicals or expensive equipment. This approach can be easily implemented in most laboratories to achieve the characterization of substances at low levels that may not be amenable to normal infrared or Raman spectroscopic methods. Two promising methods that are targeted toward similar analytical goals have been reported recently. An inexpensive method of fabricating silicon wafers coated with silver nanoparticles for use as SEIRA and SERS substrates was achieved by simply immersing a thin silicon wafer in an appropriately mixed solution of AgNO3 and HF to allow reductive preparation of silver coating.12 Another approach involves the preparation of preferentially aligned silver nanorod arrays via oblique angle vapor deposition for the SEIRA method.13 Both of these methods require elaborate substrate preparation in order to achieve high enhancement factors for SERS and SEIRA detection. On the contrary, the method of depositing silver nanoparticles on copper can be easily achieved in most laboratories with simple drop-coating or nebulizer spray techniques. This permits the analysis of trace substances by the two very popular techniques of FTIR and Raman spectroscopy. The strong signal- to-noise ratio of o-mercaptobenzoic and catechin spectra shown in Figures 1 and 2 demonstrate the sensitivity of SERS and SEIRA for approximately 0.5–1 μg and 4 μg samples being probed, respectively. In terms of mass detection limits, useful spectra can be expected at the low nanogram level for SERS and high nanogram level for SEIRA.
References
- Baker, G.A.; Moore, D.S. Anal. Bioanal. Chem.2005, 382, 1751–70.
- Xiao, X.Y.; Sun, S.G.; Yao, J.L.; Wu, Q.H.; Tian, Z.Q. Langmuir 2002, 18, 6274–9.
- Leopold, N.; Haberkorn, M.; Laurell, T.; Nilsson, J.; Baena, J.R.; Frank, J.; Lendl, B. Anal. Chem.2003, 75, 2166–71.
- Koglin, E.; Kip, B.J.; Meier, R.J. J. Phys. Chem.1996, 100, 5078–89.
- Connatser, R.M.; Cochran, M.; Harrison, R.J.; Sepaniak, M.J. Electrophoresis2008, 29, 1441–50.
- Creighton, J.A.; Blatchford, C.G.; Albrecht, M.G. J. Chem. Soc., Faraday Trans. 21979, 75, 790–8.
- Lee, P.C.; Meisel, D. J. Phys. Chem. 1982, 86, 3391–5.
- Leopold, N.; Lendl, B. J. Phys. Chem. B2003, 107, 5723–7.
- Hildebrandt, P.; Keller, S.; Hoffmann, A.; Vanhecke, F.; Schrader, B. J. Raman Spectrosc.1993, 24, 791–6.
- Ibrahim, A.; Oldham, P.B.; Stokes, D.L.; Vo-Dinh, T. J. Raman Spectrosc.1996, 27, 887–91.
- Howes, B.D.; Scatragli, S.; Marzocchi, M.P.; Smulevich, G. J. Raman Spectrosc.2006, 37, 900–9.
- Huang, B.B.; Wang, J.Y.; Huo, S.J.; Cai, W.B. Surf. Interface Anal. 2008, 40, 81–4.
- Leverette, C.L.; Jacobs, S.A.; Shanmukh, S.; Chaney, S.B.; Dluhy, R.A.; Zhao, Y.P. Appl. Spectrosc.2006, 60, 906–13.
Dr. Ooi and Dr. Chong are with the Department of Chemistry, Middle Tennessee State University, Murfreesboro, TN 37132, U.S.A.; tel.: 615-898-5487; fax: 615-898-5182; e-mail: [email protected]. Ms. Zhao is Research Assistant, Department of Chemistry, Louisiana State University, Baton Rouge, LA, U.S.A.