The properties of long-chain molecules and polymers are tailored to meet the demands of a specific application in a range of different ways. In the production of “smart” materials and other high-performance polymers, for example, properties may be controlled by blending complementary materials or through the copolymerization of different monomers. For biopharmaceuticals, on the other hand, PEGylation (the attachment of PEG strands to a host molecule) is a common approach. This technique is widely used to modify peptides, proteins, and antibody fragments to improve efficacy, and more particularly to influence the in vivo behavior of a therapeutic.
Appropriate measurement will reveal the composition of materials having the desired properties and also highlight the presence of reaction byproducts and/or unreacted monomers. Overall it provides valuable information for optimizing both the product and the manufacturing process.
Analysis by GPC-PDA
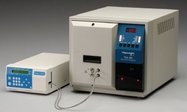
Figure 1 - PDA for the TDAMax instrument.
Gel permeation chromatography (GPC) involves steric separation of a sample, i.e., separation on the basis of size. Different detectors are used to analyze the resulting size fractions in order to quantify molecular weight and distribution, molecular size, and intrinsic viscosity. UV detection is used routinely to identify chemically different species as they elute. This is especially valuable for the analysis of copolymers and in the development of smart materials, since unique electrical, thermal, or photochromic properties often correlate directly with UV absorption characteristics. The difference in absorption profiles between polymers with similar molecular weights, refractive index increments, viscosities, or hydrodynamic radii can be significant; thus a UV detector can often differentiate when others cannot. However, a conventional system measures spectra only at a single, predetermined wavelength in the UV-VIS range. This limitation is overcome with the photodiode array (PDA) detector (Figure 1) for the TDAMax instrument (Viscotek Corp., A Malvern Company, Houston, TX).
The instrument is a comprehensive GPC system with an integrated triple or tetra detector array that includes low-angle light scattering, a differential refractive index detector, and a four-capillary differential viscometer. The PDA consists of 256 diodes and simultaneously collects data at wavelengths in the range 190–500 nm. With typical measurement times in the 20–40 min range producing a very data-rich analysis, the technique is extremely productive.
The UV cell of the PDA sits in the temperature-controlled zone of the system, which operates at temperatures up to 80 °C. A fiber-optic link to the PDA and then onto the powerful OmniSEC™ software package enables the captured data to be displayed as information-rich, easy-to-interpret 3-D images that provide insight into the nature of the sample being analyzed.
The PDA measures the complete absorption spectrum of the sample eluting at every time slice of the chromatogram, giving a fingerprint of each component in the matrix. Because it captures data across the UV-VIS range, the user does not need to select the wavelength of interest before measurement. This makes it much easier to carry out more open-ended investigative analysis into a complex polymerization reaction or when examining material about which little is known.
The software package is equally important since it simplifies data manipulation and presentation while controlling the chromatography. Looking at the full absorption spectra for each “slice” makes it easy to see what components— monomers, oligomers, different polymeric species—are eluting, giving information about molecular size and structure.
Case study: Investigating polymer blends
The work described here illustrates the power of the new GPC-PDA technology. Polymerization reactions produce compounds with a distribution of molecular weights. The properties of the polymer are dependent on this distribution, as well as being a function of absolute molecular weight and the chemical composition of the constituent monomers. Important parameters such as chemical resistance, solubility, density, and permeability are all largely controlled by these three variables. Polymer properties can therefore be modified by tuning these parameters. An alternative and/or complementary approach is polymer blending. A good polymer blend combines the desirable characteristics of one material with those of another, generating a product that is superior to both the base polymers.
Blends can be produced in one of two ways: by dissolving two polymers in a mutual solvent, which is then driven off, or by heating the polymers to a molten state and then mixing. The latter approach is usually adopted for industrial production, with blends being produced in heated extruders. Many polymer combinations are, in fact, immiscible or are miscible only within a prescribed temperature/composition range. Producing a successful blend therefore demands identification of a product with the required properties and, simultaneously, development of an effective strategy for manufacturing. Detailed analysis of a polymer blend facilitates the correlation of composition with performance characteristics, and simplifies the investigation of processing variables such as blending time.
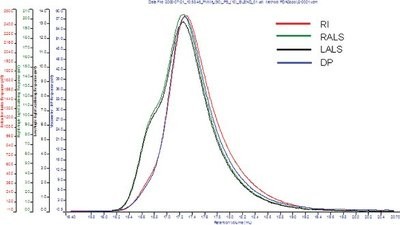
Figure 2 - Advanced multidetector chromatogram of a PS:PMMA blend (5:95). Light scattering reveals a high-molecular-weight component that could be a result of aggregation, blend, or impurities.
A blend of 5% polystyrene (PS)/95% polymethylmethacrylate (PMMA) was investigated using the Viscotek standard tetra detection platform and by GPC-PDA. Each sample was analyzed in duplicate using an injection volume of 100 μL; sample concentration was 2 mg/mL. Analysis was carried out at 30 °C, using tetrahydrofuran as the eluent. Figure 2 shows the data obtained using the tetra detection platform.
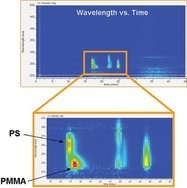
Figure 3 - Absorption contour plot produced from PDA data. It is clear that there are two components within the sample matrix. Low-molecular-weight impurities and unreacted starting material can also be qualitatively determined.
The refractive index and viscometer detectors fail to detect the presence of two components, but both light scattering detectors show a small shoulder at the high-molecular-weight end of the chromatogram. This may be attributable to the presence of two different components but could equally be associated with aggregation, blending, branching, or the presence of impurities. Figure 3 shows an absorption contour plot produced using the PDA.
This plot shows two main absorption peaks eluting at different retention times, each with a different maximum wavelength and intensity. Clearly there are two components in the sample matrix—one absorbs at around 237 nm (PMMA), and the other at around 261 nm (PS). UV absorption chromatograms at both of these wavelengths are shown in Figure 4, which was easily produced, postdata acquisition, from the information in Figure 3.
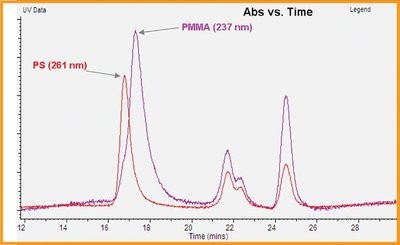
Figure 4 - Overlay of the UV absorption chromatograms for the same injection at 237 and 261 nm revealing the PMMA and PS polymers, respectively.
This plot shows that the PS elutes first and is therefore larger than the PMMA. While similar results could be obtained using a dual UV detector (which simultaneously records spectra at two wavelengths), it would be necessary to know the wavelengths of interest before analysis. These could only be determined if there were no monomer, low-molecular-weight polymer, or impurities competing in the batch UV-VIS absorption spectrum.
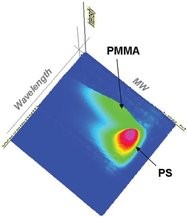
Figure 6 - Three-dimensional plot showing absorption wavelength vs absolute molecular weight vs absorption intensity. The PMMA component is shown to have a lower molecular weight than the PS but with a higher polydispersity.
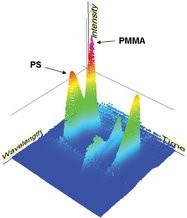
Figure 5 - Rotatable 3-D plot produced from the PDA data for the PS:PMMA (5:95) polymer blend.
Figure 5 demonstrates the ability of the OmniSEC software to display the data in a rotatable 3-D plot. This representation clearly highlights the presence of two different components and also shows by-products and unreacted starting material at the low-molecular-weight end (long retention time), providing useful information for polymerization optimization studies.
An additional useful and important diagnostic tool provided by the PDA is the ability to compare UV-VIS absorption spectra with the molecular weight for the sample. The chromatogram shown in Figure 6 was produced by measuring a 30:70 PS:PMMA blend. An absolute molecular weight distribution was obtained using the tetra detection platform. Plotting this against the PDA data gives an illustration of the absorption profile within the sample matrix. The plot shows that the PMMA component has lower molecular weight and higher polydispersivity than the PS component in the blend.
Conclusion
The introduction of a PDA detector extends the flexibility of GPC for the analysis of a multicomponent sample matrix. With GPC-PDA, the complete UV-VIS absorption spectrum of the sample is captured at every time slice of the chromatogram, providing a fingerprint of each eluting component. Wavelengths of interest can be selected postanalysis, making the technique extremely versatile. Powerful software makes data analysis simple and intuitive.
The example of polymer blend analysis shows how GPC-PDA characterizes the sample in some detail, delivering information for the optimization of process and product performance. The technique provides insight into the presence and nature of monomers, oligomers, macromolecules, and copolymers, making it well suited for both biopharmaceutical and conventional polymer applications.
Dr. Sanchez is Applications and Separations Scientist, Mr. Clarke is Divisional Product Manager Separations, and Dr. Brousseau is Business Development Specialist, Viscotek Corp., A Malvern Company, 15600 W. Hardy Rd., Houston, TX 77060, U.S.A.; tel.: 800-375-5966, ext. 108; fax: 281-931-4336; e-mail: [email protected].