Single-crystal crystallography provides accurate and precise measurements of molecular dimensions in a way that no other science can begin to approach. Small-molecule crystallographers study compounds that are both of chemical and biological interest, i.e., new synthetic chemicals, catalysts, pharmaceuticals, natural products, and many more.
The oldest and most precise method of X-ray crystallography is single-crystal X-ray diffraction, in which a beam of X-rays illuminates a single crystal, producing scattered beams of X-rays. When they are recorded on a detector, these beams produce a diffraction pattern of reflections. The intensities and angles of these reflections are recorded as the crystal is gradually rotated. X-ray crystallography studies can determine the mean chemical bond lengths and angles to within a few thousandths of an Ångström and to within a few tenths of a degree, respectively.
The idea that crystals could be used as a diffraction grating for X-rays evolved in 1912. Not much later, the first diffraction pattern of a crystal—sphalerite, a zinc, iron, sulfur mineral—was recorded on a photographic plate.
The potential of X-ray crystallography for determining the structure of molecules and minerals was recognized immediately. The earliest structures were simple inorganic crystals and minerals, but even these revealed fundamental laws of physics and chemistry. The structure of diamond was solved in 1914, proving the tetrahedral arrangement of its chemical bonds, and the first structure of an organic compound, hexamethylenetetramine, was solved in 1923.
Since the early days, X-ray crystallography has led to a better understanding of chemical bonds and noncovalent interactions. Crystallographic experiments have confirmed many theoretical models of chemical bonding, such as the octahedral bonding of metals observed in ammonium hexachloroplatinate, and the resonance observed in the planar carbonate group and in aromatic molecules. In 1928, the structure of hexamethylbenzene established the hexagonal symmetry of benzene and showed a clear difference in bond lengths between the aliphatic and aromatic carbon–carbon bonds. This finding led to the idea of resonance between chemical bonds, which had profound consequences for the development of chemistry.
An impressive illustration of the importance of crystallography in chemistry is the amazing number of 25 Nobel Prizes awarded in the field of crystallography. From 1970 to 2006, 4% of all chemistry publications dealt with crystallography, yet this subfield captured 19% of the available Nobel Prizes.1
Structure determination
In the 1960s, a small-molecule crystal structure determination still required months of data collection time. Thousands of punched cards per structure were required for calculations on slow and scarce university mainframe computers. Analysis times were brought down to weeks with the introduction of computer- controlled four-circle diffractometers in the 1970s, faster computers, auto indexing, and direct methods.
The first area detectors used in the 1980s made it possible to determine simpler structures within days, but one of the big breakthroughs came during the 1990s, with the introduction of fast and sensitive charge-coupled device (CCD) detectors, which accelerated data collection significantly, reducing a typical 3–4 day job to a few hours. The 2000s have brought ever-faster computers and automated sample handling. Robots were introduced to larger facilities for automated handling of crystalline samples.
Data collection and evaluation procedures have now evolved to a level at which most of the routine samples can be analyzed automatically in a matter of hours, but typically still require an experienced crystallographer to run the experiment. Today, crystal structure determination is so fast that it can be part of an undergraduate project.
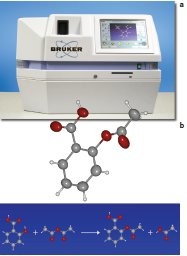
Figure 1 a) - SMART X2S benchtop system. b) 3-D structure of aspirin.
The SMART X2S benchtop system (Bruker AXS, Madison, WI) (Figure 1a) takes small-molecule crystallography to the next level of fully automated 3-D crystal structure determination with completely automated robot sample handling and automated operation in a benchtop-sized instrument that does not require any working knowledge of crystallography. Advances in source and detector technology allowed the design of a completely air-cooled system that requires only single-phase 110 V and draws less than 500 W of power.
Synthesis and 3-D structural characterization of aspirin
The familiar organic compound, aspirin, is the most widely used drug in the world. The synthesis of aspirin (Figure 1b) is a part of many undergraduate organic synthesis laboratories. These courses teach synthesis and purification skills. With the SMART X2S benchtop system, undergraduate students can now employ X-ray crystallographic methods for 3-D structural characterization in an easy and intuitive way. Crystallography provides the most unambiguous structural information of all analytical methods, and previously was only available to cutting-edge research.
In this experiment, acetic anhydride is added to salicylic acid in the presence of a catalyst, phosphoric acid. The mixture is heated to form the acetylsalicylic acid (aspirin) and acetic acid. Water is added to destroy the excess acetic anhydride and to cause the product to crystallize. Aspirin is then collected and recrystallized from an ethanol water mixture. After successful synthesis and crystallization, course participants will learn to manipulate crystals under a microscope and choose crystals suitable for X-ray structure determination.
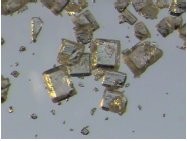
Figure 2 - Monoclinic crystals of aspirin.
Aspirin forms well-defined, colorless monoclinic crystals that are solvent free, air stable, and easy to manipulate with a preparation needle (Figure 2). Students will identify clear, nicely grown, isometric crystals for further preparation. An ideal crystal will have at least one edge with a length of about 700 μm.
Sample preparation is easy and straightforward: The crystal will be attached to the tip of a Bruker sample holder (see Figure 3). The sample holder is prealigned and features a thin polyimide-film tip, which supports the crystal that is glued using a UV curable adhesive. The advantage of UV curable adhesive is that it leaves the student ample time to manipulate the sample without the adhesive curing, but allows the crystal to be fixed in place within seconds by shining UV light on it. A protective cap is placed onto the pin, and the sample is manually inserted into the instrument for X-ray investigation (Figure 4).
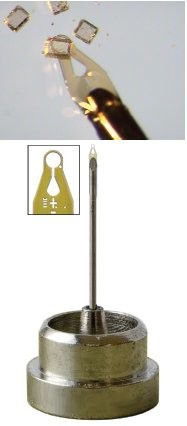
Figure 3 - Sample preparation. Attachment of a crystal to the tip of the sample holder.
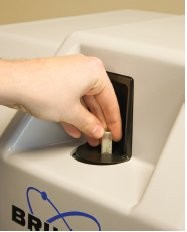
Figure 4 - Sample loading.
The SMART X2S is a true benchtop system and can be placed anywhere in the laboratory. It is extremely compact, lightweight, completely air-cooled, and requires only standard ac power. The system operates completely automated, from sample mounting and alignment to data collection, processing, and structure solution.
To start an experiment, students supply the sample and an empty CD ROM for data archiving. Basic information about the sample is provided for the report generation (i.e., chemical formula, size, and color of the crystal).
Interaction with the SMART X2S is very user friendly. The system features a kiosk-style graphical user interface (GUI) with input through a touchscreen interface (Figure 5). No crystallographic knowledge is required. The GUI is intuitive and will guide the student through the experiment, providing easy-to-understand graphical feedback about status and quality of the structure determination process.
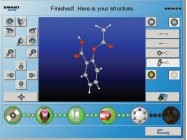
Figure 5 - SMART X2S software screen.
The automation software combines an expert knowledge of structural chemistry with the power of cutting-edge data processing engines for structure solution and refinement used in research instrumentation in laboratories worldwide. The SMART X2S software automatically determines the structure of most routine organic and coordination compounds (Figure 5).
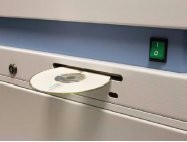
Figure 6 - Archive CD inserted in a CD ROM drive.
The system generates an interactive report in HTML format with an embedded molecule display that allows interaction with the molecule. The molecule viewer allows the student to measure distances and angles between atoms or calculate distortion angles. The molecule can be rotated and displayed in various modes (ball and stick, space-filling CPK model, molecule surface, etc.). The report will start automatically when the archive CD is inserted in any CD ROM drive (see Figure 6). The archive CD contains all data from raw images to refined structure files. These data can be used in advanced crystallography courses and are fully compatible with Bruker’s suite of crystallographic research software.
Reference
- Seringhaus, M.; Gerstein, M. Chemistry Nobel rich in structure. Science Jan5, 2007, 315(5808), 40–1.
Dr. Ruf is Software Development Manager, Bruker AXS Inc., 5465 East Cheryl Pkwy., Madison, WI 53711-5373, U.S.A.; tel.: 608-276-3000; fax: 608-276-3006; e-mail: [email protected]; www.bruker-axs.com.