Rheology is the study of the deformation of matter. A common definition is that rheology is the study of flow. Viscometry, in particular, is the measurement of viscosity or the resistance to flow. Vane rheometry is the measure of material flow or deformation behavior with vane spindles. It is becoming more widely accepted as a convenient means of testing materials that: 1) are heterogeneous or have more than one component, and 2) may slip when measured with smooth spindle geometries such as cone-plate, coaxial cylinder, parallel-plate, or a disk spindle immersed in a beaker.1,2 Chunky peanut butter, with small nut pieces throughout the smooth butter, is heterogeneous. Petroleum jelly slips when tested with cylindrical spindles—only an extremely thin layer adheres to the spindle, while the rest of the sample essentially breaks away and is no longer connected.
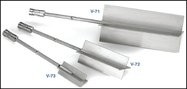
Figure 1 - Brookfield vane spindles.
A vane is defined as a flat measuring surface that essentially sticks out into the sample material and effectively “grabs” and pushes it as the spindle rotates. The rotating element or rotor is commonly referred to as a spindle or bob. The thin profile of this spindle allows it to be inserted into various samples without causing appreciable disturbance or damage, in contrast to other geometries. Commercial vane spindles most commonly have four blades, as shown in Figure 1.
If the sample material does not stick to the rotating element—that is, it slips— then the resulting viscosity readings may be erroneously low. Vanes are very useful in testing heterogeneous materials, particularly those with significant amounts of suspended solids in a relatively low-viscosity liquid. Examples include: 1) mineral slurries, including clays; 2) foods such as fruit-filled yogurts; and 3) construction materials such as crumb-rubber-filled asphalt emulsions. Cases 1 and 2, in particular, are situations in which the smooth geometries may effectively test the low-viscosity matrix liquid, while the suspended particles migrate away from the rotating spindle surface. Vanes extend into and grab and test the mixture as a whole, thus much more accurately indicating the resistance that an industrial mixing or pumping system may experience. This information is essential to the proper design of such plant processes.
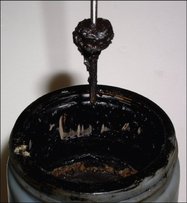
Figure 2 - Small disk spindle.
One user, for example, prepared a crumb-rubber-filled asphalt emulsion to a specification requiring a viscosity test with a small disk spindle (see Figure 2) in a large, cylindrical container. However, industrial-scale mixer motors repeatedly burned out when working with the material at the job site. The problem was that the motors were actually undersized, based upon erroneous data. This was because the smooth spindle mainly tested the suspended liquid next to the rotating spindle. Therefore, rotational viscometry tests were subsequently run, comparing the smooth-geometry and vane results.
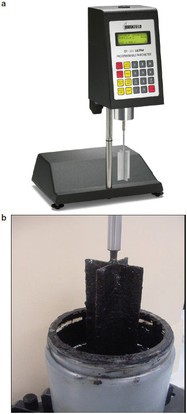
Figure 3 - a) DV-III-series Ultra rheometer with b) vane spindle.
The crumb-rubber-filled asphalt emulsion was analyzed by constant-speed or controlled-rate tests at room temperature using 1) a HB-range DV-III-series rheometer and V-71 vane spindle, shown in Figure 3, and 2) a RV-range DV-III-series rheometer with RV-4 disk spindle. Rheocalc™ software was used for automated instrument control and data acquisition. (All products mentioned in this article are from Brookfield Engineering Laboratories, Inc., Middleboro, MA.)
The data acquisition speed or data interval was initially set to 1 point per sec to capture the torque rise in the early part of the experiment, and was then set to a lower rate to collect fewer data points where the torque varied less with time. Vane spindles measured viscosities at least five times higher than those measured with the smooth geometry, as shown in Figure 4, because the vane tested both the liquid and its suspended solids. This provided a more accurate rheological representation of the product.
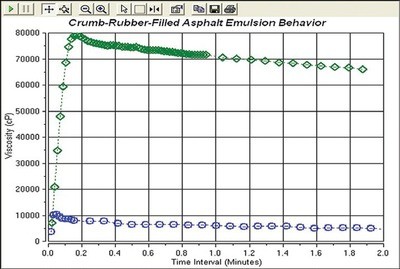
Figure 4 - Comparison of vane (green) and disk spindle (blue) viscosity values for crumb-rubber- filled asphalt emulsion.
Materials that fracture during testing and then slip often exhibit initially high (viscosity) readings that drop down to negligible values. This is observed in certain greases; foods such as mashed potato mixtures, mayonnaise, and puddings; and petroleum jelly. A cylindrical spindle drills a hole into such materials. This is sometimes referred to as channeling, that is, a channel is created around the spindle immersed in the material. Vane spindles are useful in testing these samples as well.
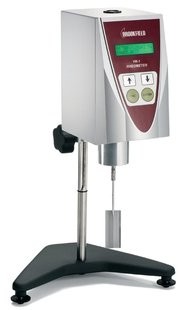
Figure 5 - YR-1 yield rheometer with vane spindle.
Numerous materials, including those mentioned above, behave as solids when left alone. They flow as liquids when sufficiently stressed—such as by a mixer or pump, or the push of a spatula or knife. The yield stress is the point at which a solid begins to flow as a liquid. The corresponding sample deformation is the yield strain. The YR-1 yield rheometer is used with vane spindles to perform simple yield tests. This instrument is shown in Figure 5. EZ-Yield™ software provided instrument control and data acquisition. Low speeds are typically used in these tests, often 1 rpm or less. The motor rotates, and the spring begins to wind up; the sample resists the spindle motion. Practically speaking, significant sample flow commences when a maximum stress is achieved and the sample structure breaks down.
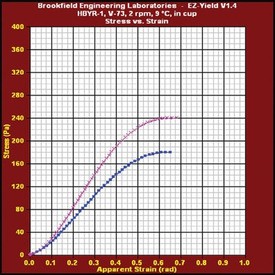
Figure 6 - Yogurt yield test data—stress vs apparent strain.
Different yogurts were easily tested for yield stress in their cups, after being removed from a refrigerator, using a HB-range YR-1 yield rheometer with V-73 vane spindle. These controlled-rate tests were run at 2 rpm. The stress versus apparent strain curves for the two yogurt samples are shown in Figure 6.
This simple test shows that the first yogurt (purple trace) is stiffer or firmer than the second yogurt (blue trace). The slope of the stress–strain curve, or modulus, is greater for yogurt 1. Additionally, the yield stress of yogurt 1 is higher than that of yogurt 2—the yield stress is the peak value of the stress–strain curve. These characteristics affect the texture or “mouth-feel” of the yogurt.
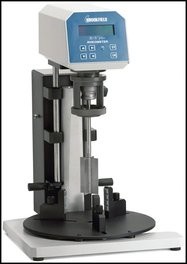
Figure 7 - R/S-SST-series rheometer.
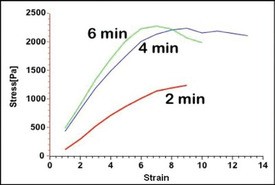
Figure 8 - Yield test results for reconstituted mashed potatoes as a function of mixing time.
Reconstituted mashed potatoes were tested with a vane spindle using a R/S-SST-series rheometer, shown in Figure 7, in controlled-rate mode with RHEO 3000™ software. The stress–strain curves in Figure 8 show that the greater the mixing time (after adding water to the dehydrated product), the higher the modulus and the shear stress. The more thoroughly mixed product feels firmer and more satisfactory to the consumer.
Controlled-stress mode applies a stress to the sample and the resulting deformation is measured. The static yield stress is the point at which the material begins to flow appreciably and the shear rate becomes significant or nonnegligible. The behavior of raspberry was tested while in its jar with the R/S-SST-series rheometer and a vane spindle, as shown in Figure 9.
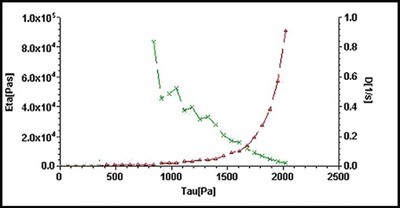
Figure 9 - Controlled-stress test data for raspberry jam. Shear rate, D, s–1 (red) and viscosity, Eta [Pa·s] (green) versus stress, tau [Pa].
Substantial deformation and flow begins at a stress of approximately 900 Pa and, as the stress increases, the sample structure breaks down further. Thus, the resulting measured shear rate increases and the viscosity of the sample steadily decreases. This shear-thinning or pseudo-plastic behavior often occurs after yield in numerous materials.
In summary, vane rheometry provides a useful method for analyzing rheologically complex materials. It is particularly advantageous for testing samples that are significantly heterogeneous or that slip when tested with conventional, smooth spindle geometries such as coneplate, parallel-plate, or coaxial cylinder. Data may be obtained using different test modes, including controlled-rate or controlled-stress, for example, and may include viscosity, yield stress, and modulus. This information ultimately helps practitioners design processes or improve their material products in a variety of industries.
References
- Barnes, H.A.; Nguyen, Q.D. Rotating vane rheometry—a review. J. Non-Newtonian Fluid Mechanics2001, 98, 1–14.
- Nguyen, Q.D.; Boger, D.V. Measuring the flow properties of yield stress fluids. Ann. Rev. Fluid Mechanics1992, 24, 47–88.
Dr. Moonay is Sales Engineer/Rheology Laboratory Supervisor, Brookfield Engineering Laboratories, Inc., 11 Commerce Blvd., Middleboro, MA 02346, U.S.A.; tel.: 508-946-6200; fax: 508-946-6262; e-mail: [email protected]. The author thanks his colleague, John M. Walters (Senior Sales Engineer) for providing R/S-SST rheometer data; Nicole H. Benoit (summer student/engineering intern), who acquired the yogurt data; Kathy Durant (Marketing/Media Assistant) for providing photographs; and Robert G. McGregor (Domestic Sales Manager—Laboratory Instruments) for helpful comments.