The products we stir, pump, spread, pour, and spray are usually thought of as liquids. Surprisingly, however, it can be demonstrated that they live a quiet double life as liquids when observed, but retreat into a little-known soft-solid character when left to their own devices. Because this double life imparts many desirable processing, storage, and performance attributes to manufactured products, it is important to understand it.
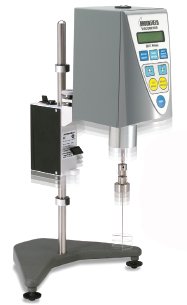
Figure 1 - Rotational viscometer with Helipath stand and
T-bar spindle.
An interesting viscosity measurement paradox helps to illustrate this point. Consider two skin treatments: a foot cream that applies easily and rubs out to a silky finish, and a soothing emollient for diaper rash and eczema, known for its thick and heavy feel when applied to the skin. The prescribed method for performing a viscosity check is straightforward. A rotational benchtop viscometer is equipped with a T-bar spindle and Helipath stand (Brookfield Engineering, Middleboro, MA) that is well suited for soft solids, and a quick, single-speed viscosity test is run to confirm the relative viscosity of each cream (see Figure 1). The measurement results were unexpected: thin foot cream: 13,740 poise (or 1,374,000 cP), and thick emollient: 10,520 poise (or 1,052,000 cP). The viscometer was working well, and the method is an established one for these products. How can a high-viscosity emollient deliver a lower measured viscosity value than the foot cream?
On closer inspection of the undisturbed samples in their tubs, a different picture emerges: The low-viscosity foot cream actually appears to have a degree of firmness not seen in the creamier emollient. In other words, the relative consistencies depend on whether one is poking the material or spreading it. This is an example of the double life of structured liquids.
Products such as suspensions, emulsions, and gels possess structure—internal continuous networks due to colloidal interactions, polymer entanglements, and associations—that impart solid-like characteristics to the product. An example of these solid-like characteristics can be seen clearly in mayonnaise. Consider a large spoonful of mayonnaise on a plate. It does not appear to be flowing at all. Furthermore, if the mound of mayonnaise is pushed gently with a spoon, it deforms slightly but bounces back to its original shape when the spoon is removed. This is due to the elastic deformation of the mayonnaise on the application of stress and its subsequent recovery on the removal of the imposed stress. In other words, the mayonnaise exhibits solid-like behavior. However, this type of behavior is seen only when there is gentle handling of the mayonnaise. If pushed a little harder, the structure “breaks” and the mayonnaise flows, demonstrating liquid-like behavior. If the applied stress is reduced, the gel-like structure recovers and solidity promptly returns.
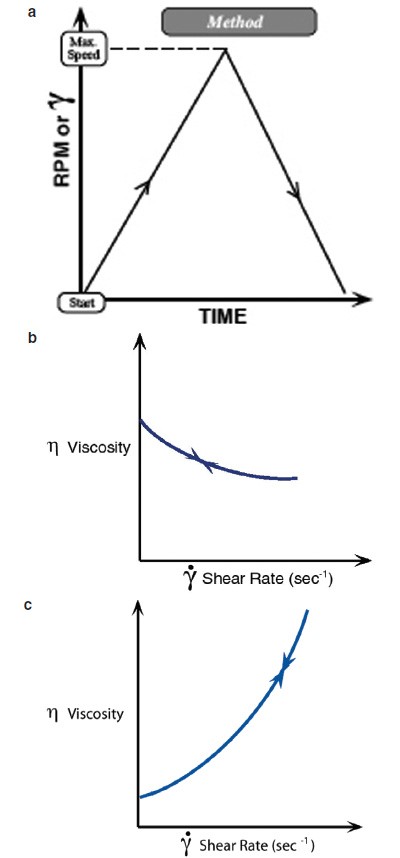
Figure 2 - a) Test method known as shear rate ramp. b) Viscosity profile for shear thinning material (pseudoplastic behavior). c) Viscosity profile for
shear thickening material (dilatant behavior).
A two-state solution
These two states—the deformable and elastic soft solid under gentle stresses and the free-flowing liquid that emerges at higher stresses—are drastically different. Further, these "liquids," as we tend to label them, spend most of their low-stress, at-rest life cocooned in solidity in a bottle or tub during storage on a shelf. For only a few moments, when they are pumped, spread, stirred, or sprayed, they experience life as a liquid, hence the double life of structured liquids. The soft-solid structure of these products should not be overlooked or ignored. Structure contributes to many critical performance attributes, such as:
- Texture, both of foods in the mouth and topical products on the skin
- Sag and slump resistance
- Penetration
- Dripping and draining characteristics.
Thus, a measurement of soft-solid structural properties, such as rigidity and strength, is very valuable. Herein lies the problem: A measurement method for liquids (i.e., viscosity) is not suitable for measuring solids. Similarly, a method for measuring solids (i.e., rigidity, strength, or firmness) is meaningless when applied to a liquid. The best way to deal with this is simply to perform both structure and flow tests to obtain a more meaningful, comprehensive characterization of the product.
Flow test methods
Most companies perform a QC check for viscosity with a single-point measurement. This means using one spindle at a defined speed and reporting a single number, as explained above. Formulators will run a flow curve test for viscosity during R&D to create the product. This involves testing the material at different rotational speeds to observe how viscosity will change as a function of shear rate. Figure 2 shows graphs of the test method and possible outcomes. Sometimes, QC will be required to run more than a single-point test to ensure optimal quality of product.
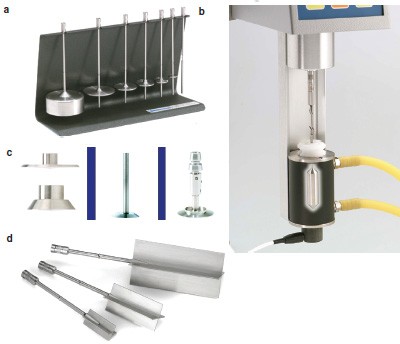
Figure 3 - a) Disk-type spindle. b) Coaxial cylinder spindle geometry. c) Cone/plate spindle geometry. d) Vane spindle.
Choice of spindle for the viscosity test is typically made by R&D. Disk-type spindles are most commonly used, provided there is plenty of sample available for testing (at least 0.5 L). When sample availability is limited (<20 mL), coaxial cylinder geometry (cylindrical spindle inside of a cylindrical chamber) is an option. For even smaller sample volumes (<2 mL), cone/plate geometry is the alternative. Figure 3 shows images of each spindle type. There are many other spindle geometries, such as the T-bar mentioned earlier, that are appropriate for certain types of materials.
The two sample materials described above were also tested with the cone/plate geometry. The shear rate selected was 250 sec–1, which correlates with applying the creams to the skin with a steady rubbing action. Test results were as follows: thin foot cream: 543 cP, and thick emollient: 3460 cP.
The cone/plate method provides the means to simulate the higher shear rate of rubbing, and the test data confirm that, as expected, the thin foot cream exhibits much lower viscosity than the thick emollient.
Structure test methods
For years, many viscometer users have, in fact, unknowingly performed structure tests to very good effect. The T-bar viscosity is actually a measure of structural strength. The key parameter is the torque required for the T-bar spindle, driven by the Helipath stand, to cut a path through a soft-solid sample. As such, it is more related to yield stress—the stress that must be applied to disrupt structure and initiate significant flow—than a true viscosity under shear. What other established approaches can be taken to comprehend the structure of a material?
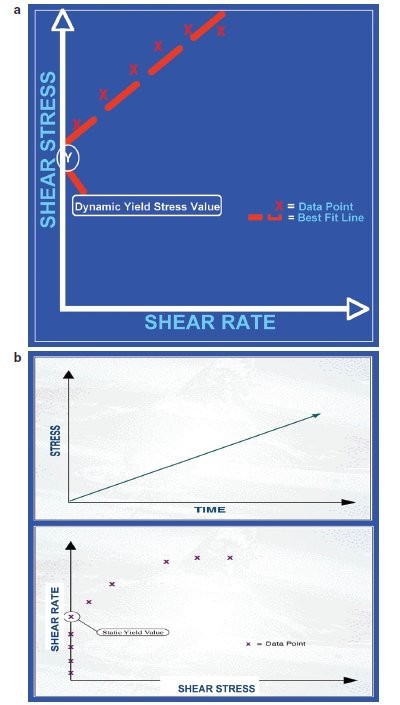
Figure 4 - a) Dynamic method for determining the yield
stress of a material. b) Static method for determining the yield stress of a material.
Material strength
Two common methods are available to measure this value:
- Use the flow curve data from a standard viscosity test, plot shear stress versus shear rate, and extrapolate back to zero shear rate (see Figure 4a). This technique gives a dynamic yield stress because it infers the result after the fluid has already been allowed to flow.
- Use an instrument that measures static yield stress directly. This means that the material must be measured in an at-rest condition. Controlled stress rheometers have this capability (see Figure 4b). The technique is to apply a gradually increasing torque to the spindle and detect the moment the spindle begins to rotate.
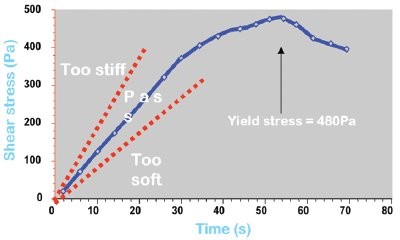
Figure 5 - Graph of material tested for rigidity or firmness.

Figure 6 - Texture analyzer with extrusion cell.
Rigidity/firmness
When applying an increasing force to a material in order to initiate flow, the elastic resistance to being deformed is the characteristic of interest. Consider a jar full of jelly. Pushing the jelly down gently onto the surface with a finger causes the jelly to deform, but it returns to its original shape when the finger is removed. When pushed harder the resistance feels greater, but the jelly still returns to its original condition after the finger is removed. The amount of resistance detected is directly proportional to the speed with which the finger is pressed into the jelly. Two methods are used to obtain this measurement:
- Using a standard viscometer, a vane spindle (see Figure 3d) is immersed into the material, the spindle is rotated at a very slow speed (0.1-1.0 rpm), and shear stress or torque versus angle of rotation is plotted. The slope of the line is a measurement of rigidity (also thought of as firmness or stiffness) (see Figure 5).
- Another type of instrument, known as a texture analyzer (see Figure 6), pushes a probe down into the material at a defined speed and measures the force resistance during penetration. The force is plotted as a function of the distance that the probe penetrates into the material. The slope of the line is again a measurement of rigidity.
Conclusion
Fortunately, these tests are easy to perform and the instrumentation is a modest investment. In fact, most companies already have a rotational viscometer with variable speed capability. Now it is simply a matter of becoming familiar with the different spindles that can be used with this instrument and practicing the tests described above. The ultimate goal, of course, is to generate product that has even better quality (consistent flow properties and structure) than what has been manufactured to date.
Mr. Cunningham is a Consultant, Rheology School, Hampshire, U.K.; tel.: +44 (0) 1730 829858; e-mail: [email protected]; www.rheologyschool.com. Mr. McGregor is Marketing Manager, Brookfield Engineering Laboratories, 11 Commerce Blvd., Middleboro, MA 02346, U.S.A.; tel.: 508-946-6200; fax: 508-946-6262; e-mail: [email protected].