Honey is a natural substance produced in honeycombs by honeybees under special conditions.1 For centuries, honey has often been referred to as nature’s medicine. It is known to help heal bronchial infections, and contains several antioxidants. In addition, honey has an anti-infective component and has been used to treat coughs, intestinal ailments, and skin wounds.2 Heavy metals present in the atmosphere, such as lead and cadmium, may be transferred to flower nectar and finally to honey and cause environmental pollution.3 Thus, a rapid, convenient method is needed to accurately determine trace heavy metals that are harmful to health.
Despite the availability of many methods for the measurement of heavy metals (i.e., graphite furnace atomic absorption spectrometry [GFAAS], inductively coupled plasma-atomic emission spectrometry [ICP-AES], and ICP-MS), these methods are somewhat limited. For example, it is difficult to treat samples with high salt solutions using ICP-based procedures,4 and mass spectrometers are expensive.5 GFAAS has been widely used in the measurement of trace heavy metals due to its high precision, sensitivity, and convenience. 6 This article describes the rapid determination of lead and cadmium in honey samples using GFAAS.
Experimental
All measurements were carried out on a NovAA® 400 graphic furnace atomic absorption spectrometer (Analytik Jena, Jena, Germany) with a hollow cathode lamp at 283.3 and 228.8 nm for lead and cadmium, respectively. Standard solution was prepared according to the standard procedure, and pure water was redistilled from a Human UP-900 Ultrapure water system (Nanjing Ke-Jie Instruments Co., Ltd., Nanjing, China). All reagents were purchased from chemical suppliers and used without further purification.
Table 1 - Program for GFAAS*
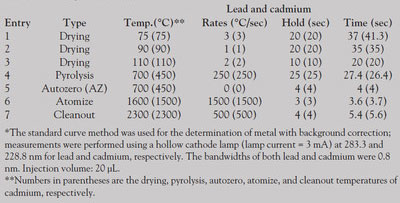
Honey samples were prepared as follows: 2 g of honey was treated with 2 mL of concentrated nitric acid and 0.5 mL of hydrogen peroxide for 12 hr. The resulting solution was then heated until a large amount of brownish-yellow gas appeared. The digestion solution was then transferred to a volumetric flask and diluted with water to 50 mL. Operating conditions of the instrument are summarized in Table 1.
Results and discussion
Sample preparation
It is necessary to pretreat the honey prior to measurement. Incineration, in which all organic compounds are burned off, is widely used. However, overincineration or incomplete incineration significantly affects the determination. In this work, honey was treated with HNO3:H2O2 followed by heating to remove organic compounds. A mixture of HNO3:H2O2 (4:1) was found to be optimal in light of the absorption.
Effects of atomization and ashing temperature
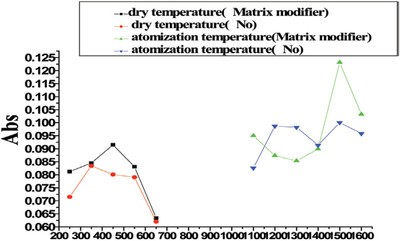
Figure 1 - Atomization temperature and dry temperature of cadmium.
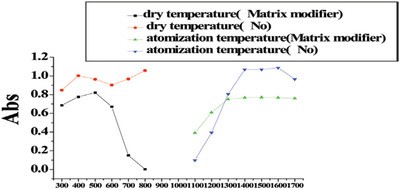
Figure 2 - Atomization temperature and dry temperature of lead.
Matrix modifiers recommended by the manufacturer of the NovAA 400 were carried out for the investigation of atomization and ashing temperature. The relationship between atomization, ashing temperature, and absorbancy when a standard solution of cadmium (2 ppb) and lead (101 ppb) and Cd (2 ppb) was used (see Figures 1 and 2, respectively).
Effects of matrix modifiers
Matrix modifiers can improve the thermal stability of the analyte. Matrix compounds can be removed effectively at higher ashing temperature, thus reducing interference of the matrix. NH4H2PO4 (1%) and Mg(NO3)2 (0.05%) were used as matrix modifiers. As can be seen in Figures 1 and 2, matrix modifiers increased the atomization temperature of lead by 200 °C; the atomization temperature of cadmium was unchanged. The ashing temperature of both lead and cadmium increased by 100 °C.
Linearity of the calibration curve
An autosampler cup charged with a standard solution of lead (80 ng/mL), matrix modifiers, and ultrapure water was placed inside of the autosampler disk. The standard solution was diluted and injected automatically according to the optimized program of the instrument. A linear correlation was observed with the correlation coefficient 0.9999. The regression equation is shown in Eq. (1):
ABS (absorbance) = K1 + K2 × conc./1 + K3 × conc. (Eq. 1)
where K1 = 0.040883, K2 = 0.011753, and K3 = 0.015237.
In the case of cadmium, the correlation coefficient was 0.9998; the regression equation is depicted in Eq. (2):
ABS = K1 + K2 × conc. (Eq. 2)
where K1 = 0.003857 and K2 = 0.031457.
Precision
Table 2 - Precision determination results (ng/mL)
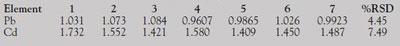
Honey samples were pretreated as described above. The relative standard deviation (RSD) of each solution was less than 10%. The results and RSD of repeated measurements are listed in Table 2.
Determination of recovery
Table 3 - Recovery results
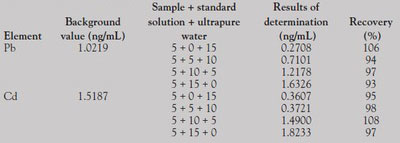
In the honey samples tested, the mean value of determination (n = 7) was used as the background value. The experimental results show that the recovery rate of the standard addition method for lead and cadmium was 93–106% and 95–108%, respectively (Table 3).
Determination of honey samples
Table 4 - Determination results for honey samples
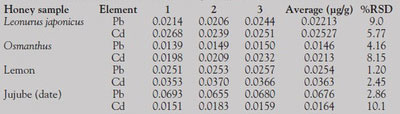
Honey samples such as Leonurus japonicus, lemon, osmanthus, and jujube (date) were employed for the determination of lead and cadmium. The results are summarized in Table 4.
Summary
A high-precision, high-sensitivity method was presented for the measurement of lead and cadmium in honey by graphic furnace atomic absorption spectrometry. The method offers convenient, accurate, and rapid determination of heavy metals in honey and other foods.
References
- Huang, W.-K. Honey and Its Products. Beijing: China Light Industry Press, 1991.
- Bing, D.-G. Physiological function and its exploitation and utilization. Special Wild Ecomomic Animal and Plant Research2004, 57–9.
- Porrini, C.; Ghini, S.; Girotti, S.; Sabatini, A.G.; Gattavecchia, E.; Celli, G. Use of honey bees as bioindicators of environmental pollution in Italy. In Honey Bees: Estimating the Environmental Impact of Chemicals; Devillers, J.; Delegue, M.H.P., Eds.; CRC Press: Boca Raton, FL, 2002; pp 186–247.
- Lin, T.-W.; Huang, S.-D. Direct and simultaneous determination of copper, chromium, aluminum, and manganese in urine with a multielement graphite furnace atomic absorption spectrometer. Anal. Chem. 2001, 73(17), 4319–25.
- Meeravili, N.N.; Kumar, S.J. Slurry-sampling with rapid atomization versus microwave digestion with conventional atomization for the determination of copper, manganese and nickel in algae matrix using transverse heated-electrothermal atomic absorption spectrometry. Anal. Chim. Acta2000, 404, 295–302.
- Silva, M.M.; Goreti, M.; Vale, R.; Caramào, E.B. Slurry sampling graphite furnace atomic absorption spectrometry; determination of trace metals in mineral coal. Talanta 1999, 50, 1035–43.
The authors are with the Laboratory of Applied Chemistry and Chemical Engineering, College of Chemistry and Chemical Engineering, China West Normal University, Nanchong 637002, China; tel.: +86 81 72314608; e-mail: [email protected].