As discussed in last November’s Editor’s Page,1 the life sciences are the key sector propelling growth in microscopy and imaging. A large part of biological research centers inside the cell. While those internal structures and processes are still important, the rise of molecular biology and biophysics is driving new interest in both the cell membrane and in measuring the cell’s nanomechanical properties, both at the cellular and molecular level. This shift is opening new life science opportunities for atomic force microscopy (AFM).
New opportunities in life science research
Atomic force microscopy offers a number of advantages that make it a powerful partner to the optical techniques used in the new biologies. It requires no dehydration, sample labeling, or surface coating; operates well in liquids and on live cells; and can detect at the single-molecule level. In comparison, optical techniques often use fluorescent labels to tag organelles or subcellular components such as nucleic acids, proteins, or lipids. Also, while optical techniques are typically limited in XY resolution to about 180 nm, AFM extends XY resolution to the nanoscale. New AFM modalities provide insightful quantitative data such as elasticity, modulus, adhesion, and deformation, as well as a minutely controllable nanoprobe to maneuver cell structures; apply precise mechanical stimuli; and measure very low force interactions between or even within single molecules.
However, enabling AFM to make the transition into the life sciences is far from trivial. Today’s biological microscopy is built on correlative imaging. On the optical microscopy (OM) side, that means interfacing a myriad of modalities ranging from normal brightfield to phase contrast, DIC (differential interference contrast), fluorescence, TIRF (total internal reflection fluorescence), FRET (fluorescence resonance energy transfer), FRAP (fluorescence recovery after photobleaching), and confocal microscopy. Until recently, integrated AFM/OM systems have been limited, lacking especially key tools like phase and DIC.
The transition also places new engineering requirements on the AFM itself. Imaging delicate, living cells demands a gentler touch than is typically required for AFM’s more robust, original targets like polymers, metals, and semiconductors. AFMs require finesse to adjust correctly, especially with biological samples in fluid. To be considered a true member of the correlative imaging suite, a biologically oriented AFM needs easy-to-use, precise co-location for optical and AFM experiments, with exact image overlay. Finally, it should extend to spectroscopy for chemical identification. The BioScope Catalyst from Bruker Nano Surfaces Division (Santa Barbara, CA) elegantly addresses all of these challenges.
Preparing the experiment
Sample preparation for the AFM part of integrated microscopy experiments is straightforward. AFM does not require staining like fluorescence, or dehydration and metal coating like electron microscopy. If live cells are of interest, they can be grown on conventional substrates. To maintain cell viability, the BioScope Catalyst can be fitted with a Perfusing Stage Incubator (PSI) which controls temperature, gas flow, and pH, maintaining living cells at near-physiological conditions in excess of 48 hours.
Peak Force Tapping and quantitative nanomechanical mapping
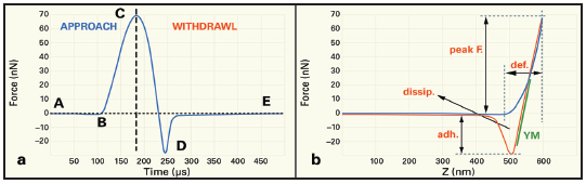
Figure 1 a) One cycle of the Peak Force Tapping curve. This process is repeated at every XY pixel in the image, at a rate of typically 2000/sec. b) Resulting quantitative measurements
Figure 1 illustrates the physics behind a new AFM mode, Peak Force Tapping (Bruker), which is especially suited to life science applications. In this mode, the probe is oscillated at a low frequency (1–2 kHz), capturing a force curve (as shown in Figure 1a) each time the AFM tip taps on the sample’s surface. By directly controlling the tip–sample interaction, Peak Force Tapping provides a gentler touch that is better suited to delicate live cell and biological imaging at the nanoscale. It also produces true quantitation of biophysical and nanomechanical properties critical to the next generation of biological research.
The curve A–E tracks one Peak Force Tapping cycle. During the approach, the cantilever begins at a noncontact force (A) at a discrete distance above the sample. The Z piezo pushes it downward until it touches the surface (B), then continues to gently push until the cantilever reaches the setby point, (C). The setpoint is a measure of the magnitude of the tip–sample interaction and is used to create the topography image.
After reaching the peak force at point C, the piezo withdraws, pulling off the surface at point D, the “maximum adhesion point.” Finally, the curve levels out again as the probe tip returns to its original noncontact force (E).
Tight control of the probe position and feedback enables this heartbeat pattern to produce an array of direct measurements simultaneously at each pixel (Figure 1b), extending Peak Force Tapping to “quantitative nanomechanical mapping” or QNM. The Peak Force is measured at C, relative to the noncontact force, A, and is used as the imaging feedback signal. As the probe is scanned over the surface, this signal generates the topography image. Adhesion is measured at D, relative to the noncontact force E, and Young’s modulus is obtained by fitting the classical Hertzian contact mechanics model to the red retraction curve (C to D). The area between the blue approach curve and the red retraction curve reflects the energy dissipation. The distance that the tip indents into the sample is reported as deformation.
Peak Force Tapping versus conventional AFM modes
Biological samples are susceptible to damage during AFM imaging. Peak Force Tapping is unique in that it directly controls the tip–sample forces at ultralow levels while at the same time minimizing lateral forces. In comparison, while traditional Contact mode directly controls the vertical tip–sample imaging force, it generates high lateral forces as the tip scans over the surface, which can dislodge loosely bound entities from the substrate or damage soft samples. Conventional Tapping mode greatly reduces these lateral forces by oscillating the tip such that it only intermittently contacts the sample as it scans. However, it is difficult to accurately estimate the imaging force with Tapping mode.
Furthermore, because the oscillation is related to the resonance frequency of the cantilever used, Tapping mode must be “tuned,” requiring identification of the optioptimum cantilever resonance. In liquids, multiple peaks often appear, making tuning a challenge. In contrast, Peak Force Tapping operates at a fixed frequency, eliminating the need for cantilever tuning.
ScanAsyst: Automatically optimizing images
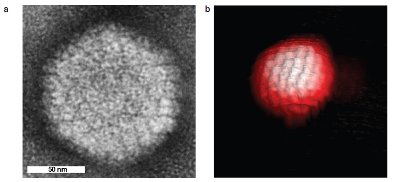
Figure 2 High-resolution Peak Force image of a single Herpes simplex virus capsid. a) Transmission electron microscopy (TEM) image (courtesy of Wouter Roos, Vrije Universiteit, Amsterdam, The Netherlands. Reprinted with permission from Ref. 2). b) 3-D Peak Force image (BioScope Catalyst), in buffer, using ScanAsyst Fluid + AFM probes (k ~0.7N/m). Scan area: 250 nm. (Sample courtesy of Dr. Wouter Roos and Prof. Gijs Wuite, Vrije Universiteit. Image courtesy of Bruker Nano Surfaces Group.)
Both Contact mode and Tapping mode rely on careful optimization of key imaging parameters such as the imaging setpoint gain, and scan rate. Optimizing these parameters produces the best images but requires significant experience and constant attention from the operator since the values drift over time.
In comparison, Peak Force Tapping operates under ScanAsyst, proprietary feedback technology. Under ScanAsyst, special algorithms and feedback systems constantly monitor image quality and then automatically adjust the setpoint, gain, scan rate, z range, and noise threshold to maintain ultralow forces, even over long periods of time. The results are simple, consistent imaging and greater stability, even on challenging, high-resolution samples in fluids. Engineered with an eye to flexibility, ScanAsyst also allows for fully manual control or control over individually selected parameters.
The advantages of this low-force, directly controlled oscillation are well demonstrated in Figure 2. This ScanAsyst/Peak Force image of a virus capsid is free from distortion or damage by the AFM probe. Note the high-resolution detail of the 3-D aggregates of proteins (capsomeres) formed on the protein shell (capsid) surface of this virus. The high vertical and lateral forces exerted by Contact mode would crush or dislodge these delicate, loosely bound structures.
The capsid protects the virus outside the cell as it seeks a host to infect. Its structure is used to classify the virus. Previously, identification relied on X-ray crystallography, nuclear magnetic resonance (NMR) imaging, and electron microscopy, all of which are expensive, time-consuming, and require extensive sample preparation unnecessary with Peak Force Tapping.
Nanomechanical properties go submolecular
Peak Force QNM takes AFM to new limits in ultrahigh resolution, simultaneously mapping both topography (Figure 3a) and nanomechanical properties (modulus map, Figure 3b). Zooming into the highlighted regions of interest on each (lower left corners, generating C and D, respectively) reveals delicate loops connecting subunits within the protein, Bacteriorhodopsin (green coils) at unprecedented submolecular resolution.3 Prior to Peak Force QNM, it has not been possible to measure mechanical properties at this scale within a native biomembrane.
MIRO: Correlating, Guiding
The ultimate power of correlative microscopy comes from the ability to precisely overlay an image collected in one modality on a second image, taken with a complementary modality. To achieve this goal, BioScope Catalyst uses “MIRO” (Multiple Image Registration and Overlay) software. MIRO controls all aspects of data management, from identifying regions of interest and correlating structure and function parameters to driving the AFM to regions of interest to either image or measure. It also manages the file structure for easy archiving and retrieval.
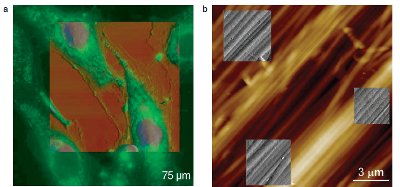
Figure 4 a) Fluorescence image overlaid with AFM topography map (AFM scan size 75 μm). Living endothelial cells tagged with the membrane potential sensitive dye bisoxonol, 100×/1.4 NA oil objective. (Data courtesy of C. Callies and H. Oberleithner, Institute for Physiology II, University of Muenster, Germany.) b) AFM/AFM multiple area overlays of rat tail collagen revealing 66-nm bending pattern
As shown in Figure 4, MIRO precisely overlays different imaging modalities (Figure 4a) or even multiple ROIs in the same experiment (Figure 4b). Additionally, it can overlay images collected changing under environmental conditions, or time–lapse series. MIRO also controls camera brightness, contrast, gamma, and resolution, as well as turning the camera on or off to minimize vibration.
A quick, simple calibration ensures accurate registration. To maximize registration accuracy, multiple registration profiles can be collected for different microscopy configurations. For subsequent experiments, the user can then just register the tip position. Using a polynomial dewarping algorithm, MIRO can also correct for optical aberrations.
As shown in Figure 5a, MIRO can use the fluorescence image as a reference, in this case, a field of live endothelial cells, and then dynamically drive the AFM to a specified region of interest (dashed circle) to measure. Figure 5b shows the force curve quantifying the elasticity of the cell membrane over the nucleus (green “+”, dashed circle, Figure 5a). Use of widefield fluorescence for navigation dramatically reduces the time required to perform the AFM portion of the experiment and preserves the integrity of both the tip and the sample.
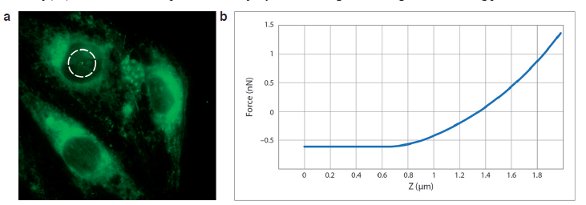
Figure 5 Optically guided force spectroscopy, living endothelial cells. a) Fluorescence image is used to define a region of interest. b) AFM measurement, cell membrane elasticity. Fluorescence acquired with 100×/1.4 NA oil immersion objective. AFM: Contact mode, in liquid, 37 °C, using Bruker MicroLever (MLCT) probes (0.02N/m). (Data courtesy of C. Callies and H. Oberleithner, Institute for Physiology II, University of Muenster, Germany).
Summary
The BioScope Catalyst opens new vistas for life science research. Its ScanAsyst and Peak Force QNM modes offer a gentler, more controlled, and directly quantitative solution especially well-suited for molecular biology, biophysics, and true nanomechanical studies. The powerful MIRO software precisely overlays nanoscale AFM imaging and measurements with light, confocal, and the various fluorescence modalities, providing new insights into cell dynamics and nanomechanics. This new approach produces high-resolution images at all size domains, from single molecules to biomolecular aggregates such as membranes, then on to cells and tissue. ScanAsyst and Peak Force QNM promise to be exciting new tools for a wide range of applications, from the pathology of cancer, infectious diseases, and neurodegenerative disorders to proactive, commercialized technology in tissue engineering, biomemetics, and biosensors.
References
- Foster, B. The state of microscopy for 2012. Am. Lab. Nov/Dec 2011, 43(11), 4–6.
- Roos, W.H.; Radtke, K. et al. Scaffold expulsion and genome packaging trigger stabilization of herpes simplex virus capsids. Proc. Natl. Acad. Sci. USA2009, 106, 9673–8.
- Rico, F.; Su, C. et al. Mechanical mapping of single membrane proteins at submolecular resolution; dx.doi.org/10.1021/nl202351t, NanoLetters2011, 11(9), 3983–6.
Barbara Foster is President & Chief Strategic Consultant, The Microscopy & Imaging Place, Inc., McKinney, TX, U.S.A., and Consulting Editor, American Laboratory/Labcompare; tel.: 972-924-5310; e-mail: [email protected]; www.MicroscopyMarket.com..
`