Many laboratories performing proteomics analysis utilize conventional nano-HPLC, which can result in limited separation and ionization, reducing the productivity and amount of peptide and protein identification that can be performed. Nano-ultrahigh-performance liquid chromatography (UHPLC) offers a reliable solution to address the analytical requirements of proteomics research, delivering increased pressure rating capabilities while allowing laboratories to select the most appropriate column dimensions and materials. This article details an experiment performed by the University of Southern Denmark’s Center for Experimental Bioinformatics (CEBI) (Odense) to investigate the effectiveness of different column dimensions and solid-phase materials using nano-UHPLC technology. Nano-UHPLC technology increased peptide and protein identification by 34% and 22%, respectively, representing a significant achievement for proteomics research and discovery purposes.
Proteomics laboratories have traditionally relied on nano-HPLC for their analyses. However, the technique is not powerful enough to meet the separation requirement of proteomics applications, considerably reducing the number of protein and peptide identifications that can be performed. Increasing the analytical power is very important for both life science and research purposes, especially discovery proteomics. One solution is to equip conventional HPLC instruments with thinner and longer columns, thereby enhancing analytical capabilities. This configuration does not incur any additional sample loss since the internal volume of the column remains unchanged, but pressure limitations can quickly become a problem.
Effect of column dimensions, flow rates, beads/solid-phase material, and bead size
Nano-UHPLC technology has emerged as a viable alternative to conventional HPLC, pushing the limits of feasible column designs through higher operational pressure. The technique offers increased pressure rating capabilities, while also allowing scientists to investigate the effectiveness of different column dimensions and solid-phase materials and select the most appropriate ones for their application. Nano-UHPLC can be used in conjunction with mass spectrometry systems, enabling an improved number of peptide and protein identifications to be achieved and enhancing laboratory productivity. In particular, on-line nano-UHPLC allows longer, smaller-inner diameter (i.d.) columns, which improves chromatographic performance.
Nevertheless, migrating from nano-HPLC to nano-UHPLC and coupling directly to a mass spectrometer requires alterations to the setup to allow for the increase in pressure. It is also necessary to systematically evaluate the experimental parameters, including column dimensions (length and i.d.), flow rate, beads/solid phase material, and bead size, and how they influence the chromatographic performance of the system. It is also important to take into careful consideration that using a high-pressure technology can result in increased internal connection leaks, while manufacturing small-i.d. columns can be a challenging task. State-of-the-art on-line nano-UHPLC technology has been designed to effectively address these challenges.
Experimental
Methodology
A nano-UHPLC instrument (Easy-nLC 1000, Thermo Fisher Scientific, Odense, Denmark) was coupled to a mass spectrometer (LTQ or LTQ Orbitrap XL, Thermo Fisher Scientific) for detection. A one-column setup was used with predominantly in-house prepared columns having varying specifications. For baseline comparisons, a 75-μm-i.d., 20-cm-long column packed with 3-μm ReproSil-Pur® C18-AQ beads (Dr. Maisch GmbH, Ammerbuch-Entringen, Germany) was used. Alternative column dimensions (length and i.d.) were tested, as were various flow rates and bead brands/sizes, including HyperSil Gold (Thermo Fisher Scientific, San Jose, CA), Kinetex® core/shell (Phenomenex, Torrance, CA), and 1.9-μm ReproSil-Pur.
All in-house columns were prepared as pulled emitters using a model P-1800 laser puller (Sutter Instruments, Novato, CA) and TSP050375 coated fused-silica capillaries (Polymicro Technologies, Phoenix, AZ). Pulled tips were inspected and packed with a self-assembled frit.1 After the frit had formed under low pressure, the column was packed in a bomb loader at 100 bars with methanol, overnight if necessary.
HPLC-grade solvents were prepared as A: 0.5% acetic acid in water from a MilliQ™ water purification system (Millipore, Billerica, MA) and B: 0.5% acetic acid, 80% acetonitrile in water. The solvents were degassed and exchanged regularly. For acquisitions of bovine serum albumin (BSA), the mass spectrometer was used with a gradient from 13% to 33%B in 20 min, then to 100%B to wash, and back to 2% for a certain amount of time, depending on the flow rate, to allow all peptides to elute. For complex samples, the Orbitrap™ mass spectrometer (Thermo Fisher Scientific) was employed with a gradient increasing from 10% to 35%B in 120 min. The instrument was set to acquire a full-scan spectrum at a resolution of 60,000, automated gain control (AGC) target of 1e6 ions, and maximum injection time of 500 msec. In parallel, 10 collision-induced dissociation (CID) MS2 scans were acquired in the ion trap of the 10 most intense ions, and dynamic exclusion was enabled with an exclusion period of 45 sec.
Data were processed using a software platform (MaxQuant version 1.0.13.13, Thermo Fisher Scientific2) and searched against Uniprot Mouse (April 2011) using Mascot 2.3 from Matrix Science (Boston, MA). In-house developed software was used to extract features from BSA acquisitions in an automated manner.
Results: flow rates and ionization efficiency
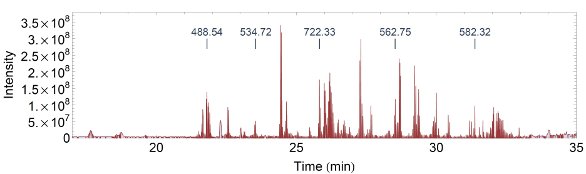
Figure 1 - TIC of a few selected peptides from 50 fmol BSA: m/z 488.54: TCVADESHAGCEK 3+, 534.72: QNCDQFEK 2+, 722.33: YICDNQDTISSK 2+, 562.75: ECCHGDLLECADDRADLAK 4+, 582.32: LVNELTEFAK 2+.
Initially, a wide range of column dimensions and solid-phase materials were tested to find a solution yielding the highest analytical power, with backpressure as a nonlimiting factor due to the use of UHPLC. A BSA digest was chosen as a simple mixture to narrow down the field early using short gradients on the mass spectrometer. A total ion chromatogram (TIC) for BSA is depicted in Figure 1, with selected peptides of interest tagged.
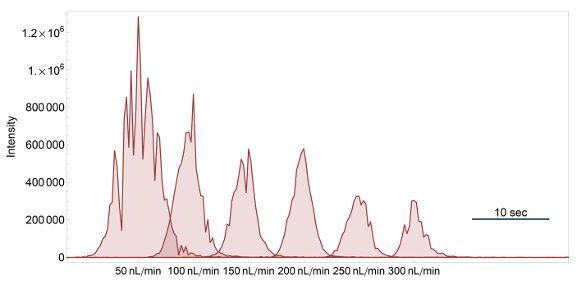
Figure 2 - Extracted ion chromatograms for m/z 534.72 (QNCDQFEK, 2+) at flow rates from 50 to 300 nL/min on a 45-cm-long, 50-μm-i.d. column.
The test varying the flow rate turned out to be of greater importance than initially expected and, along with the potential increase in ionization efficiency, it was included as a major factor in the considerations.3 Figure 2 illustrates the effect on a single BSA peptide. The signal intensity increased at lower flow rates while the peak width was affected, but not in a uniform direction.
To be able to capture the large quantity of information in a reproducible manner, a script was prepared to process extracted ion chromatograms (XICs) from acquisitions using the MultiplierZ framework (The Blais Proteomics Center, Dana-Farber Cancer Institute, Harvard Medical School, Boston, MA).2 This script was set up to automatically process newly recorded BSAs producing up to 114 XICs per run. A postprocess/viewer was written in Java, extracting centroids, median peak widths (FWHM), and a few other pieces of information.
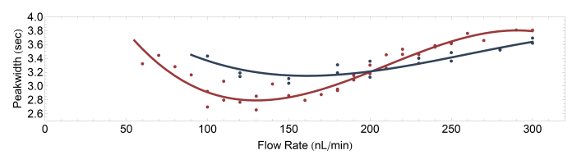
Figure 3 - Flow rate versus observed peak width plots for two columns: 20 cm, i.d. 75 μm (in blue); 45 cm, i.d. 50 μm (in red).
Figure 3 shows the median peak width from a standard 20-cm-long, 75-μm-i.d. column traditionally used at CEBI versus a 45-cm-i.d., 50-μm high-pressure column. Both were pulled columns packed to the tip with ReproSil-Pur 3-μm beads, selected based on initial tests on several different materials to reduce the number of variables. The optimal flow rate for both columns appeared to be lower than 250 nL/min. However, for standardization purposes, it was decided to use a 250 nL/min flow rate for the short column and a 125 nL/min flow rate for the long column in subsequent tests.
The particular column dimensions and flow rates were chosen for two additional reasons. First, the internal volume of the two columns are identical, thus having roughly the same amount of beads; second, the velocity of the liquid phase across the beads (in mm/sec) using half the flow rate on the 50-μm column is similar: 0.24 versus 0.27 mm/sec (had the columns been empty).
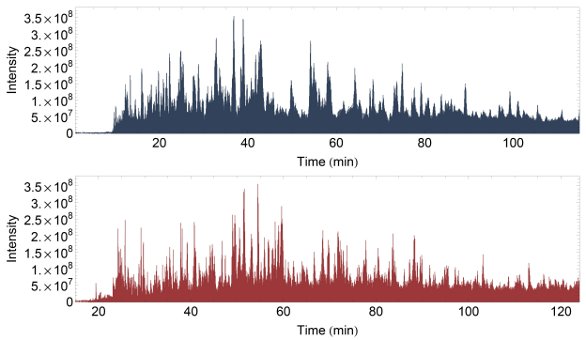
Figure 4 - TIC for a complex sample on a short column: 20 cm, i.d. 75 μm (in blue); and a long column: 45 cm, i.d. 50 μm (in red). Retention time is shifted 15 min but otherwise highly reproducible (slope 1.0017, R2 0.99).
BSA digest is well-suited for testing column performance, but the complexity is far too low to test the performance of modern mass spectrometry equipment. To overcome this issue, a sample of mouse dendridic cells lysed and digested with trypsin was obtained. This is a representative sample commonly used in proteomics studies. Proteins from roughly 50,000 cells were used for each injection. Figure 4 presents the TIC data from Orbitrap mass spectrometry acquisitions of this complex sample on both the 20-cm and 45-cm columns. The long but narrow column ran at a 125 nL/min flow rate versus the 250 nL/min flow rate chosen for the short column. Two replicates were acquired on each column.
The four acquisitions were analyzed, and 1072 proteins were identified with a false discovery rate of less than 1% (both peptide and protein). The number of identified peptides (distinct by sequence) was 2346 and 2506 for the short column and 3243 and 3272 for the long column—an increase of 34%. Protein identifications increased by 22%, from 696 and 733 to 868 and 879.
Both gradients were identical, but due to the reduced flow rate, the peptides eluted almost 15 min later on the long column. The long column had a significantly reduced number of peptides being sequenced more than once, but less than one-third of the new identifications could be explained this way, based on the number of acquired spectra. Improved ionization and/or separation were observed in many cases. An example of peptides eluting from both columns can be seen in Figure 5.
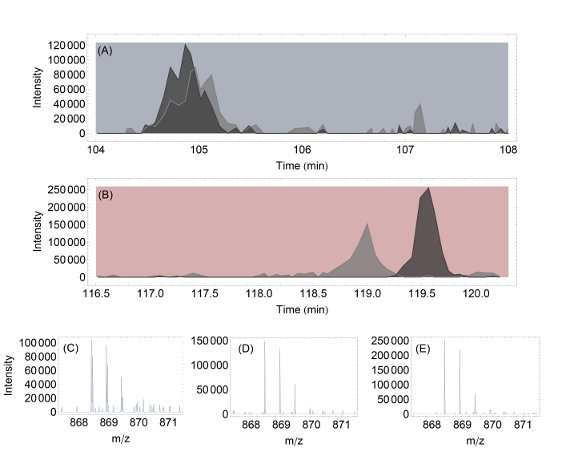
Figure 5 - Comparing chromatographic separation for a short column (20 cm, i.d. 75 μm) and a long column (45 cm, i.d. 50 μm): a) XIC for two coeluting peptides on a short column (light gray: m/z 868.46, dark gray: m/z 868.42), b) XIC on peptides from a long column, c) MS on peptides from a short column, d) and e) separated peptides from a long column.
Conclusion
Nano-UHPLC significantly increases the number of protein and peptide identifications that can be performed, while also broadening the freedom of column and flow rate selection. Experimental data demonstrate that 50-μm columns offer superior analytical capabilities, whereas systematic chromatographic assessment using low-complexity analytes can be extrapolated to complex mixtures found in proteomics research. In addition, nano-UHPLC enables flow rate optimization, with ionization efficiency improving at lower flow rates.
References
- Ishihama, Y.; Rappsilber, J. et al. Microcolumns with self-assembled particle frits for proteomics. J. Chromatogr. A 2002, 979(1–2), 233–9.
- Parikh, J.R.; Askenazi, M. et al. MultiplierZ: an extensible API based desktop environment for proteomics data analysis. BMC Bioinformatics 2009, 10, 364.
- Ficarro, S.B.; Zhang, Y. et al. Improved electrospray ionization efficiency compensates for diminished chromatographic resolution and enables proteomics analysis of tyrosine signaling in embryonic stem cells. Anal. Chem. 2009, 81(9), 3440–7.
Lasse Gaarde Falkenby, Msc.; Jakob Bunkenborg, Ph.D.; and Jens S. Andersen, Ph.D. Professor, are with the Center for Experimental Bioinformatics (CEBI), University of Southern Denmark, Odense, Denmark. Ole Hørning and Christian Ravnsborg are with Thermo Fisher Scientific, Edisonsvej 4, DK-5000 Odense C, Denmark; tel.: +45 6557 2300; fax: +45 6557 2301; e-mail: [email protected].