Interest and concern about the levels of mercury in its various forms in the environment have been well documented over the last 50 years. Organomercury compounds in particular have received widespread attention, highlighted by the Minamata Bay disaster, which sparked off concern over mercury in aqueous ecosystems. Mercury levels in water, soil, petrochemicals, and coal-fired stack emissions have been regulated for many years. Permissible levels of mercury are being lowered by regulatory bodies, placing significant demands on the various standard methods of analysis approved both in the U.S. (U.S. EPA Methods 1631, 245.1, 245.7, and SW-846 747770- 74-71) and the EN13506 (soon to be integrated into the ISO regime). The criterion for freshwater systems is currently set at 12 ng/L; for saltwater the level is 25 ng/L.1 While there are several commercially available instruments that can readily measure such levels, there are still major issues to be addressed in order to obtain accurate measurements. Sampling, storage, pretreatment, contamination, and interferences are all potential sources of error that should be considered carefully before and during analysis.
Instrumentation
The use of atomic fluorescence for the determination of mercury was first reported by Thompson and Reynolds in 1971.1 Since then, several authors3-5 have described enhancements to the technique that reduced formal instrument detection limits (IDL) for the technique in the 1-10 ng/L range. Knox et al.6 reported on the use of atomic fluorescence for the determination of mercury with a detection limit of less than 1 ng/L. European standard EN13506, based on atomic fluorescence for the determination of mercury in drinking water, was published in 2001, while the most recent version of U.S. EPA Method 1631 utilizes an additional gold amalgamation step to reduce the limits of detection even further.
Since the introduction of the fully automated Merlin atomic fluorescence system for mercury (P.S. Analytical Ltd., Kent, U.K.), there have been a considerable number of instrumental systems developed throughout the world. There are some who now believe that the analytical measurements are well facilitated by the range of instruments available in the marketplace, especially when the predicted levels of performance available from these instruments is considered. They also tend to believe the data produced without question, which can be a concern. Results from even the most recent interlaboratory trials have shown a wide range of variation between results obtained for the same sample analyzed in different laboratories. This is even the case for water samples, which should be considered a relatively simple matrix. Analytical procedures involve not only the measurement aspect of the procedure, but involve the sampling, collection, and pretreatment prior to the actual measurements. These sampling procedures are frequently outside of the control of the analyst, which can lead to many problems. Collecting a sample that is representative of the matrix being tested must take into account the characteristics of the analyte being tested; even for water samples, the collection of representative samples for mercury analysis can be a major difficulty. To enable the analyst to perform mercury measurements that are suited to the purpose, the analyst must have an in-depth knowledge of mercury and the matrices in which it is to be measured. Given a well thought-out analytical procedure, the prospect of interferences should be minimized, i.e., the pretreatment process should overcome any possible interferences.
The two most recently introduced regulatory methods for mercury analysis are U.S. EPA Method 1631 and EN13506. The latter was derived from the U.K. Blue Book method originally developed by Prof. Clive Thompson at Alcontrol Laboratories (Rotherham, South Yorkshire, U.K.) (formerly Yorkshire Water). However, EN13506 has one serious change from the original method—the preservation procedure uses potassium dichromate rather than the bromate/bromide reagent scheme promulgated by the Yorkshire Water methods. The rationale for this was that the dichromate preservation was relevant to other metals that might be analyzed via alternative techniques. Recently, the CEN method was introduced into the ISO process, but with one change: the dichromate preservation was dropped and the bromate/bromide reagent was reintroduced.
The principle of the analytical procedure for total mercury in waters, surface ground industrial and domestic wastewaters, and saline waters is described briefly here. An aliquot of acidified sample is digested using chemically generated bromine chloride employing a bromide/bromide reagent. The bromine chloride breaks down the common organomercury species and converts these to mercury (II). Elemental mercury is then generated from these digested samples by reduction with tin (II) chloride, and the mercury is purged from the solution via a gas stream. The mercury is then detected by atomic fluorescence spectroscopy, although atomic absorption techniques are also applicable in situations in which the levels are not as demanding. Automating these procedures also provides significant advantages, but only if the analyst takes sufficient care while carrying out the measurements. Of the automated procedures available, continuous-flow measurements offer superior performance, particularly since the correct matching of reagents, blanks, and samples ensures that the measurements relate correctly to the level of mercury in the sample and are not affected by reagent quality.
Analytical instrumentation for mercury analysis by vapor generation atomic fluorescence spectrometry
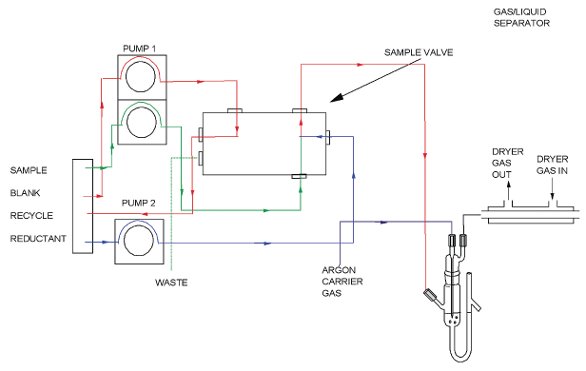
Figure 1 - Schematic diagram for a continuous-flow vapor generation atomic fluorescence spectrometer system.
A schematic diagram for a continuous-flow vapor generation atomic fluorescence spectrometer system is shown in Figure 1. The apparatus comprises an autosampler, a vapor generation system (illustrated as a continuous-flow module, although flow injection models are available), a specially designed gas/liquid separator, an atomic fluorescence spectrometer (AFS), and a computer with associated software for control and data processing. For U.S. EPA Method 1631, a gold trap is also integrated into the flow path. However, being a performance-based method, U.S. EPA 1631 does not require that the gold trap be used if the performance requirements are fully met by the analytical system. Argon gas is used to transport the mercury from the gas liquid separator to the AFS system.
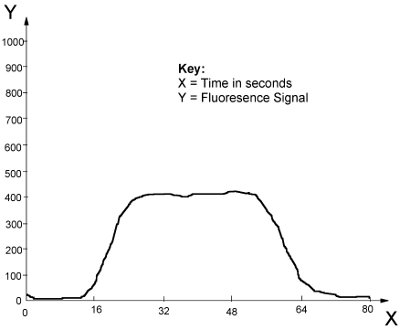
Figure 2 - Typical AFS signal.
The instrument should be set up according to the manufacturer’s recommendations. It should be calibrated with a minimum of five standards, which should be matrix-matched to the samples under test. Figure 2 shows a typical AFS signal produced from samples or standards. From a stable baseline, the introduction of the sample/standard will produce a variation from the baseline, rising to a plateau when the signal is in equilibrium. As the sample/standard is removed, the signal will return to the baseline and the level of mercury present can be quantified either by the peak height or peak area.
The design criteria used by the manufacturer will determine the range of measurements that can be achieved and also the rate of such measurements. The ability to analyze high samples and then low samples within a short time is determined by the system configuration.
Gold amalgamation AFS systems
Instruments utilizing an additional gold amalgamation step place an extra level of quality on the reagents (both solutions and gases) used in the instrumentation. During the collection phase, any small amount of mercury present in these reagents will concentrate on the gold to be evolved once the trap is heated. Additional costs may be incurred for quality reagents, although the authors have found that reagents chosen for the level of mercury may indeed incur no such penalty, i.e., careful selection can provide suitable reagents at reasonable cost. It is also the authors’ belief that the correct choice of reagents to minimize the background mercury levels is the single most relevant step to take for accurate, low-level mercury measurements.
Sample collection, preservation, and storage
For the determination of mercury in aqueous samples, the samples should be acidified with high-purity nitric acid at the time of collection to <2. Normally, 3 mL of (1 + 1) acid per liter of sample is sufficient. The sample should not be filtered prior to analysis.
Because of the poor stability of mercury in aqueous solutions at low concentrations, expedited delivery of samples (overnight mail in refrigerated package) to the laboratory is necessary. Upon receipt at the laboratory, all samples must be immediately processed using the digestion procedure described earlier. Once processed, samples may be stored for short periods of time; however, all samples must be analyzed within seven days of collection. This is the recommendation of U.S. EPA Method 1631, although the authors suggest that for even better control, samples should be collected in containers containing the digestion reagents; in this way, samples are ready for analysis when they reach the test laboratories. For all aqueous samples, a field blank should be prepared and analyzed as required by the data user. The same container and acid used in sample collection should be used.
An aliquot of the sample (30–40 mL) should be transferred to a 50-mL tared container. The sample may also be dispensed by weight, in which case the volume can be calculated from the density and the weight of the sample aliquot. A record of the volume used should be taken; 7.5 mL of 33% vol/vol hydrochloric acid and 1 mL 0.1N potassium bromate/potassium bromide reagent should be added before the solution is diluted to 50 mL with water, after which the vessel should be closed.
The samples should then be allowed to stand for at least 30 min or during storage. If the samples are to be stored, they must be analyzed within seven days of collection. If the yellow coloration due to free bromine does not persist after 30 min or during storage, an extra 1 mL of 0.1N potassium bromate/potassium bromide reagent should be added. A blank should then be made containing the same amounts of reagents and analyzed along with the corresponding samples. Prior to analysis, the excess bromine should be removed by addition of a few microliters of hydroxylamine hydrochloride.
Contamination
One of the biggest problems facing analysts carrying out trace metal determinations is contamination. Contamination can occur during sampling, transportation, preparation, and analysis. Much of the historical data on the concentrations of dissolved trace metals in seawater are erroneously high because the concentrations reflect contamination from sampling and analysis rather than ambient levels. The philosophy behind contamination control must be to ensure that any object or substance that comes into contact with the sample is metal free and free from any material that may contain mercury or its compounds. The integrity of the results produced cannot be compromised by contamination of the samples, sampling apparatus, or labware. Some suggestions for control of sample contamination are given below.
Sampling
Potential sources of trace metal contamination during sampling include the use of contaminated sample containers and sampling equipment, metallic or metal-containing material such as laboratory gloves that contain high levels of zinc in the talc, and contaminated reagents used in the stabilization of the mercury. Even the choice of boat used to collect the water samples can have an effect, since metal-hulled vessels have been shown to contaminate the water being sampled. In an extreme case, the breath of people with dental amalgam fillings is suspected of contaminating water samples.
Only fluoropolymer or borosilicate glass containers should be used for samples that will be analyzed for Hg because Hg vapors can diffuse in or out of other materials, resulting in results that are biased low or high. In addition, it is essential that any materials used in the preparation and analysis, regardless of construction, must be known to be clean and mercury free before proceeding. In a case in which there is the potential for contamination from any of the apparatus, sampling must be stopped. The suspect material must be returned to the laboratory or cleaning facility for proper cleaning before any sampling activity can resume.
Preparation
Contamination can also occur in the laboratory during sample preparation and analysis. Again, all reagents, flasks, and pipets that are used are potential sources of contamination. In an ideal situation, a Class 100 cleanroom should be used, although if this is not possible then a Class 100 clean bench or nonmetal glove box fed by mercury and particle-free air or nitrogen could be used. Digestions should be performed in a nonmetal fumehood, preferentially in the cleanroom. Laboratory benches and fume cupboards should also be scrupulously cleaned before sample preparation commences.
Exposure of laboratory apparatus should be minimized to the extent that it should only be opened or used in the cleanroom or glove box. When not in use, the apparatus should be covered with clean plastic wrap; stored in the clean bench or in a plastic box or glove box; or bagged in clean, zip-type bags. Minimizing the time between cleaning and use will also help to diminish contamination.
Analysts should wear clean, nontalc gloves during all operations involving handling of the apparatus, samples, and blanks. Only clean gloves may touch the apparatus. If another object or substance is touched, the glove(s) must be changed before resuming handling of the apparatus. If it is even suspected that gloves have become contaminated, work must be halted, the contaminated gloves removed, and a new pair of clean gloves put on. Wearing multiple layers of clean gloves will allow the old pair to be quickly stripped with minimal disruption to the work activity.
Apparatus that may not directly come into contact with the samples may still be a source of contamination. For example, clean tubing placed in a dirty plastic bag may pick up contamination from the bag and subsequently transfer the contamination to the sample. Therefore, it is imperative that every piece of the apparatus that is directly or indirectly used in the collection, processing, and analysis should occur as far as possible from sources of airborne contamination.
Analysis
During analysis, samples can become contaminated by the autosampler cups or vials. Cross-contamination may occur when a sample containing a low concentration of mercury is processed immediately after a sample containing a relatively high concentration. When an unusually concentrated sample is encountered, a blank should be analyzed immediately following the sample to check for carryover. Samples known or suspected to contain the lowest concentration of mercury should be analyzed before samples containing higher levels.
Additional contamination issues
Over the 20 years that the authors have been involved in the measurement of trace elements, in particular mercury, the most common mistakes made relate to 1) the sampling procedures and 2) the chemicals used in the measurement. For the former, the choice of container is important, as suggested earlier, although the authors have received samples in containers that have themselves been contaminated by mercury from previous sample campaigns. New containers or, at the very least, acid-washed containers should be used for sampling. In terms of the reagents used, they should all be mercury free. This does not always require the use of an expensive or high-purity acid, e.g., aristar grades; sometimes these acids are low in certain elements but have significant levels of mercury, often in high ppt levels, which can cause problems in ultratrace measurements.
The history of samples, i.e., tracking what has occurred prior to their being submitted for analysis, is also important. One example is in the petrochemical industry, in which mercury is removed from the product prior to storage. In one instance the authors are aware of the mercury free material was stored in an old container. The results of analyzing this sample from the container showed an increase in the mercury level, proving that the container itself had been contaminated prior to storage.
Interferences
There are two types of interferences: chemical and spectral. Chemical interferents usually interfere with the vapor generation step and can be identified and overcome using a range of approaches. Interferences are normally only identified if low recoveries are observed, which is difficult in unknown samples. Use of spike recovery data is a valuable tool, but requires that every sample be analyzed with and without a spike. Continuous-flow systems offer advantages in identifying the point at which interferences may be occurring, without the need to carry out spike recovery tests or analyze certified reference materials. Continuous-flow analyzers provide characteristic peak shapes, which should only change in size with varying mercury concentrations. Often when a chemical interferent is present this characteristic peak shape is not produced, immediately alerting the analyst to a potential problem with the sample. Methods for mercury are available that, if properly applied, show no significant interferences in the analysis of ambient waters. However, in cases in which interferences may be present, two or three approaches can be used to overcome the problems. The inherent sensitivity of AFS systems allows any samples to be diluted such that potential interferents can be diluted out. This has been shown on several occasions. In systems with poorer sensitivity, this is not possible. Alternatively, the sample digestion can be changed, or an alternative reductant can be used. A study of the interferences for a range of elements is described in Ref. 7.
Atomic fluorescence is an extremely selective technique in which spectral interferences are very rare. When used in conjunction with vapor generation as the sample introduction technique, such interferences are even less frequent. Using this approach, only volatile species are introduced into the detector, thus minimizing spectral interferences. However, suppression effects resulting from a quenching of the fluorescence signal can be encountered. These effects are the result of dissolved gases in the sample solution, which can be formed during the digestion stage, or, more frequently, can be the result of the use of too much hydroxylamine hydrochloride to remove the excess bromine prior to analysis. Heating the samples allows dissolved gases to be driven off, while using the minimum amount of hydroxylamine hydrochloride for the removal of excess bromine avoids the problem of excess nitrogen being formed and causing quenching.
A significant interference can be caused by the presence of water vapor or aerosol in the fluorescence cell. The signal is again suppressed due to quenching, making it essential to remove water vapor on a continuous basis. The use of a Permapure dryer (Perma Pure Inc., Toms River, NJ) (hygroscopic membrane) is the preferred solution to this problem. In this unit, water vapor is continuously removed. The alternative to this is desiccant tubes, although care must be taken to ensure that these are replaced on a regular basis or when they are partially filled with water, since they can act as a trap and therefore remove mercury as well as the water vapor.
Applications
The bromination digestion procedure coupled to atomic fluorescence spectrometry overcomes many potential interferences, particularly interferences caused by the formation of mercury complexes with organic material; the technique will also oxidize sulfide particles. In addition, the procedure overcomes chloride interference and, as a consequence, it is suitable for saline waters. In a further attempt to minimize interferences, U.S. EPA Method 1631 specifically includes an additional step in which the mercury vapor generated by the tin (II) chloride reaction is first collected into a gold foil prior to revaporization and measurement by AFS. This has been included primarily to manage saline waters. This additional step has two effects: it increases the measurement time and can improve the levels of detection significantly. For all other environmental samples, no major interferences have been observed.
Table 1 - Sample types
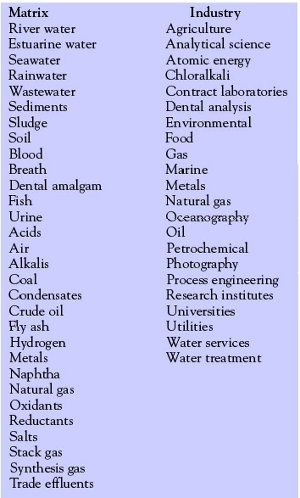
The question of interferences and problems relating to the measurement of mercury has been outlined here with particular reference to water analysis. However, mercury measurements are necessary over a wide range of environmental sample types. Table 1 shows a broad range of sample types for which analytical procedures have been developed by the authors. Measuring mercury in several of these matrices is particularly challenging. In all cases, the involvement of those generating the samples is necessary to ensure that 1) correct procedures are used for sampling and 2) the background to the samples is fully understood. In every situation, attention to detail and the use of spike recovery experiments and certified reference or known samples should be integrated into the measurement plan in order to validate the measurements. In many situations in which there are disputes over the levels of mercury present in a particular sample, the most likely cause of such deviations is due to the differences in the actual samples presented to the various laboratories. That is to say that both laboratories have the correct measurement but the samples are in fact different.
In the measurement of mercury in liquid hydrocarbons, the choice of analytical measurements and pretreatment can be critical. Prior to the development of the flask vaporization procedure (PSA 10.515 system) (P.S. Analytical) and similar instruments from other suppliers, the most likely procedure to measure mercury in these hydrocarbons was to extract the mercury from the organic phase into an aqueous phase prior to measurement using procedures similar to those described for aqueous samples. This type of measurement can only be accomplished in a reliable fashion using spike recovery measurements. Very often, the main desire for companies sending these samples for analysis is a low level of mercury. Low results may have more to do with a poor recovery from the extraction procedure than to problems with the actual measurement step. The development of analytical procedures that require no pretreatment but that give higher results do not always find favor with the client, despite the fact that these are the correct measurements. Removal strategies will have to be put in place to ensure that dangers/contamination by mercury can be overcome or controlled.
Conclusion
Atomic fluorescence coupled to vapor generation offers the analyst a useful procedure for measuring mercury at the levels of interest effectively and reliably. However, attention to detail and control of sampling, pretreatment, and measurement are paramount to providing quality data. This is not a simple or inexpensive option. However, it is vital that the measurements are correct so that the correct actions can be taken to solve the problems being evaluated. To enable clients to feel comfortable with the reliability of the measurement of mercury, the analyst may first have to convince the customer of the quality control on all aspects of the measurement cycle and that this is not inexpensive. Unreliable results that are incorrect may cause subsequent damage to safety, health, or equipment performance if they are not recognized and if corrective action is not taken.
References
- Quality Criteria for Water. U.S. EPA, Office of Water Regulations and Standards. EPA 440/5-86-001, 1986.
- Thompson KC, Reynolds GC. Analyst 1971; 96:771.
- Stockwell P, Godden R. J Anal Atom Spectrosc 1989; 4:301.
- Kammin W, Knox R. Env Lab Aug/Sept 1992.
- Potter B, Wasko MA, Long SE, Doster JA, Jones R. U.S. EPA Method 245.7, rev 1-1. Cincinnati, OH: Environmental Monitoring and Systems Laboratory, 1994.
- Knox R, Kammin WR, Thomson D. J Automat Chem 1995; 17(2):65–71.
- www.psanalytical.com
The authors are with P.S. Analytical Ltd., Arthur House, Crayfields Industrial Park, Main Rd., St. Paul’s Cray, Orpington, Kent BR5 3HP, U.K.; tel.: +44 1689 891 211; fax: +44 1689 896 009; e-mail: [email protected].