Fourier transform infrared (FTIR) spectroscopy is a well-established technique used in the compositional analysis of materials through the measurement of vibrational absorption bands. Polymers typically exhibit relatively simple absorption spectra, allowing them to be readily identified by comparison to library data, and are therefore well suited to analysis by FTIR. Gel permeation chromatography (GPC) is a common technique used for the analysis of the molecular weight distribution of polymers. Coupling FTIR detection with GPC is particularly advantageous since FTIR detection can be utilized as both a concentration detector for molecular weight calculations and as a spectroscopic tool for compositional analysis, significantly enhancing the information available from a single GPC experiment.
Typically, the analysis is carried out in batch mode, with the sample introduced into a static cell or holding device throughout the analysis. Off-line FTIR detection systems that work in batch mode have been developed for GPC, operating by first depositing the sample eluting from a GPC column onto a substrate and subsequently removing the solvent by evaporation. The drawback of this approach is that the analysis of the deposited layer must be carried out separately and the results may be influenced by the deposition conditions. Detector sensitivity issues have severely limited the development of FTIR as a flow-through detector for GPC due to the strong absorption bands of the GPC eluent that must be subtracted from the spectra to obtain sample information. It has long been realized that a simple flow-through system for coupling FTIR and GPC that involves no sample pretreatment would be advantageous for many applications.
Recent advances in FTIR spectrometers and data acquisition/data treatment software have greatly improved the sensitivity of the technique. This paper outlines the development of a flow-through detector cell that has allowed the direct coupling of FTIR with GPC for both ambient and high-temperature GPC applications.
Experimental
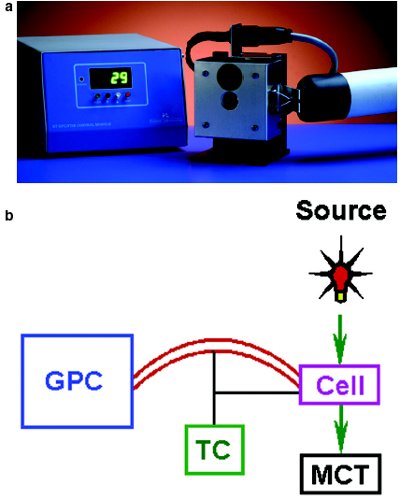
Figure 1 - a) PL-HTGPC/FTIR interface showing the heated FTIR flow cell, heated transfer line, and temperature control box. The heated transfer line can be used to interface the FTIR (situated in an FTIR detector) with a GPC system. In this image, the transfer line and cell are at ambient temperature, hence the display of 29 °C. b) Connection of the FTIR to a GPC instrument.
The coupling of a GPC system to the FTIR spectrometer was achieved using the PL-HTGPC/FTIR interface (Polymer Laboratories Inc., Amherst, MA), which is composed of a heated flow cell, a heated transfer line, and a temperature control box. The transfer line permits coupling of the cell to any GPC system such as the PL-GPC 220 (Polymer Laboratories), and the cell can be fitted into the Spectrum One (PerkinElmer, Wellesley, MA), Avatar (Nicolet, Madison, WI), and Vertex (Bruker, Billerica, MA) FTIR spectrometers as standard or adapted to other instrument designs. The flow cell is fitted with calcium fluoride windows and has an internal volume of 70 μL, which is sufficient to provide good signal-to-noise without compromising chromatographic performance. The flow cell and transfer line can be heated to 175 °C with an accuracy of ±0.5 °C to cover the range of GPC applications. Figure 1 shows the PL-HTGPC/FTIR interface. To obtain good-quality spectra, the FTIR spectrometer was fitted with a fast mercury cadmium telluride (MCT) detector. Data acquisition was performed through the spectrometer’s time-resolved data acquisition software.
The improved FTIR spectrometers and software coupled with the PL-HTGPC/FTIR interface allow the coupling of FTIR as a detection method for GPC without compromising the GPC chromatographic conditions used. Standard GPC columns, injection volumes, and concentrations (typically 2 mg/mL) can be employed, assuming the sample shows reasonable absorbance in the solvent windows of the eluent. The detection limit varies from sample to sample; typically, concentrations are less than 100 μg on-column.
For GPC with FTIR detection, an eluent must be selected that does not show significant absorption in the regions of interest since solvent absorption will also contribute to the spectrum and must be subtracted to give the spectrum of the sample. For this reason, the quality of data is dependent on the solvent, and careful selection is paramount to obtaining optimum performance for both the GPC separation and the FTIR spectroscopy. For example, although tetrahydrofuran is a typical solvent for GPC, it has limited applicability as a solvent for flow-through FTIR spectroscopy. Chlorinated solvents have the largest IR windows of the common organic solvents and thus are most useful for GPC FTIR. Unfortunately, for some polymers (e.g., polyolefins), the choice of solvent is strictly limited to those that can be used to dissolve and chromatograph the sample. In the present study, two solvents were chose—dichloromethane for ambient-temperature work and trichlorobenzene for high-temperature (160 °C) work.
Results
GPC of polycarbonate in dichloromethane
Dichloromethane is a good solvent for many GPC applications because it has a relatively wide infrared absorption window. This solvent was selected for the analysis of polymers at ambient temperature by GPC with FTIR detection.
In this application, a fast method was required that would allow samples to be screened for molecular weight and composition relatively quickly. A single analytical column was employed for the separation, and the chromatographic conditions used were as follows: column—PLgel 5 μm MIXED-C (300 × 7.5 mm) (Polymer Laboratories); eluent—dichloromethane (stabilized with amylene); flow rate—1.0 mL/min; temperature—ambient; injection volume—200 μL; detector—PL-HTGPC/FTIR interfaced to a Spectrum One fitted with an MCT detector; data collection—Timebase software (PerkinElmer) collecting at 8.0 cm–1 resolution with 16 scan accumulations for 11 min, range 3500–750 cm–1 with automatic solvent background subtraction.
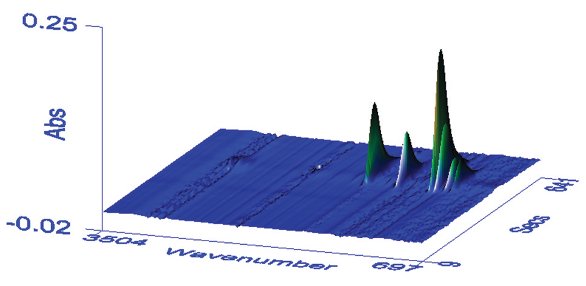
Figure 2 - Plot of time-resolved spectra for the polycarbonate. The x-axis in wavenumber (cm–1) and z-axis in absorbance represent the FTIR domain, while the y-axis is elution time, representing the GPC chromatographic domain. Individual spectra are therefore displayed from front to back. The individual peaks are due to separate polycarbonate stretching vibrations.
A polycarbonate sample was analyzed by GPC with FTIR detection. The consecutive time-resolved spectra for the polycarbonate can be plotted in a 3-D view, as shown in Figure 2. Any of the individual absorbance bands shown can be selected to generate a root mean square intensity versus time plot, which can in turn be used as a chromatogram to allow the calculation of the molecular weight distribution after calibration with appropriate standards.
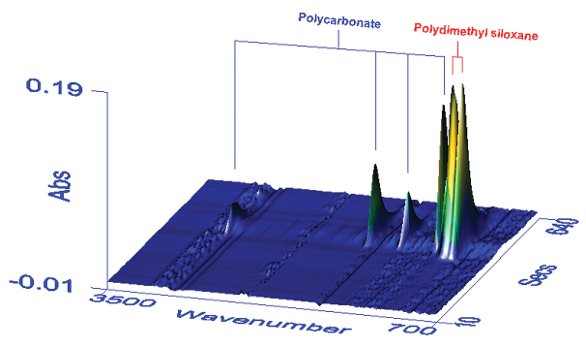
Figure 3 - Plot of time-resolved spectra for the PC/PDMS copolymer. The x-axis in wavenumber (cm–1) and z-axis in absorbance represent the FTIR domain, while the y-axis is elution time, representing the GPC chromatographic domain. Individual spectra are therefore displayed from front to back. The individual peaks are due to separate PC and PDMS stretching vibrations.
The coupling of GPC with FTIR detection allows the analysis of coeluting components of a blend or copolymer, assuming they have different infrared absorption bands. Figure 3 shows a 3-D plot of time-resolved spectra for a sample of a polycarbonate (PC)/polydimethyl siloxane (PDMS) blend, where the components are of similar molecular weight. Even though the PC and PDMS coelute, chromatograms of each component can be obtained by generating root mean square intensity plots based on the PC and PDMS absorption bands. Since the intensity of the absorption bands is directly proportional to concentration (below 1 absorption unit), the detector response may be calibrated, which in turn permits the relative amounts of the two components to be determined. In the absence of appropriate standards, molar adsorptivities can be employed for the same purpose.
Analysis of polyethylene in trichlorobenzene
Highly crystalline polyethylene is difficult to analyze by GPC due to its limited solubility in most organic solvents and the high temperatures required for dissolution (typically over 135 °C). Trichlorobenzene (TCB) is the most commonly used solvent for these materials. TCB is also a suitable solvent for GPC analysis with FTIR detection because the solvent has a good absorption window (ca. 3500–2700 cm–1), which corresponds to the >C–H stretching region. Because CH vibrations dominate the solid-state spectra of polyethylene, this absorption region is important.
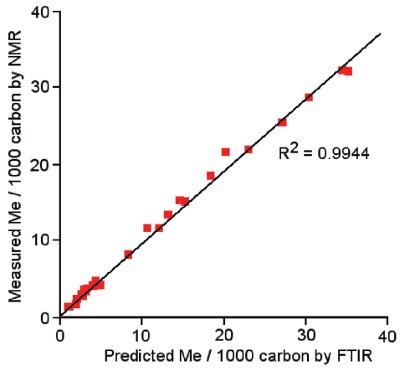
Figure 4 - Correlation between SCB results from GPC-FTIR and NMR. Data on the y-axis represent results from traditional 13C methods of determining SCB on the basis of counting chain ends; data on the x-axis were produced by the method outlined in this paper. Very good agreement can be seen between the two methods.
Focusing on the >C–H stretching region, differences in the proportions of >CH2 and –CH3 groups in a sample can be seen in the relative intensities of the absorption bands. This dependence of the infrared spectra on the presence of –CH3 and >CH2 groups can be used to measure the level of short-chain branching (SCB) in polyethylene.1 These are branches less than six carbons long that cannot be detected by traditional multidetector GPC experiments, since they do not affect the viscosity of the polymer. However, the level of SCB strongly influences the crystallinity, density, and stress crack resistance of polyethylene. By measuring the spectra of polyethylene containing SCB, the relative intensities of the stretching vibrations due to –CH3 and >CH2 groups can be measured and, provided the monomers used to introduce SCB are known, the level of SCB can be estimated using chemometrics. Coupling the detector to a GPC system allows the SCB as a function of molecular weight to be assessed. Typical analysis conditions employed were as follows: column—2× PLgel 10 μm MIXED-B (300 × 7.5 mm); eluent—trichlorobenzene (with butylated hydroxytoluene [BHT]); flow rate—1.0 mL/min; temperature—160 °C; injection volume—200 μL; detector—PL-HTGPC/FTIR interfaced to a Spectrum One fitted with an MCT detector; data collection—Timebase software collecting at 8.0 cm–1 resolution with 16 scan accumulations for 11 min, range 3500–750 cm–1 with automatic solvent background subtraction.
Figure 4 shows a correlation between the level of SCB calculated using FTIR and the values determined using a traditional NMR approach.
Cirrus GPC-FTIR SCB software (Polymer Laboratories) can be used to perform the experiments, calculating SCB based on a rigorous chemometrics approach. Figure 5 is an example of an overlaid molecular weight and SCB distributions of two samples of polyethylene determined by GPC with FTIR detection.
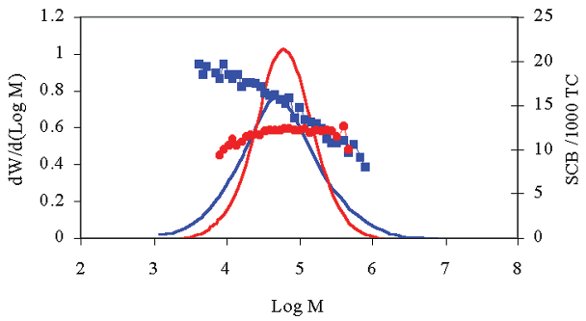
Figure 5 - Example of overlaid molecular weight and SCB distributions for two samples of polyethylene. The molecular weight distributions (the two smooth curves) of the two materials are similar; however, the SCB distributions (represented by the two lines of large data points) are very different—one is essentially independent of molecular weight, whereas the other shows a drop in SCB levels as molecular weight increases.
Conclusion
The direct coupling of FTIR detection to a GPC experiment has been demonstrated for both ambient and high-temperature applications utilizing the PLHTGPC/FTIR interface. The use of a flow cell eliminates the need to isolate the samples after separation and allows a completely on-line measurement. Employing FTIR as a detector for ambient temperature, GPC significantly increases the power of the technique, enabling the quantification of components, provided they have band resolution in the FTIR domain. Individual components of mixtures can be identified by spectral comparison and quantified, even if they coelute with other components. The coupling of FTIR to high-temperature polyethylene GPC analysis allows the chemometric calculation of short-chain branching through the measurement of the relative proportions of –CH3 and >CH2 groups. These applications illustrate the power of FTIR as a detection technique for GPC, demonstrating the greatly enhanced information content of coupling spectroscopy with separation.
Reference
- DesLauriers PJ, Rohlfing DC, Shieh ET. Quantifying short chain branching microstructures in ethylene-1-olephin copolymers using size exclusion chromatography and Fourier transform infrared spectroscopy (SECFTIR). Polymer 2002; 43:159–70.
Dr. Saunders and Dr. O’Donohue are with Polymer Laboratories Inc., Amherst Fields Research Park, 160 Old Farm Rd., Amherst, MA 01002, U.S.A.; tel.: 800-767-3963; fax: 413-253-2476; e-mail: [email protected]. Dr. DesLauriers is with Chevron Phillips Petroleum Co., Polymers and Materials Div., CPL, Bartlesville, OK 74004, U.S.A.