The quality of plastics and packaging is a key issue in many industries, such as food and beverage, pharmaceutical, and cosmetics, both from its safety and protective functions. Among the quality parameters that are strictly controlled, odor is crucial. Consequently, olfactive features must be monitored from the product development stage.
The first step in identifying odors objectively is to use panels of human test subjects to detect and rate odors on the basis of how pleasant or unpleasant they are. Responses of these panels can then be correlated with measurements of volatiles in plastics made with standard instrumental analytical methods such as GC-MS. However, the latter techniques cannot be easily linked to human perception.
The use of electronic noses, which consist of gas sensor arrays and pattern recognition technology, allow the global analysis of odors in correlation with human assessment.
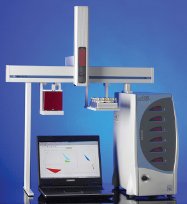
Figure 1 - FOX system.
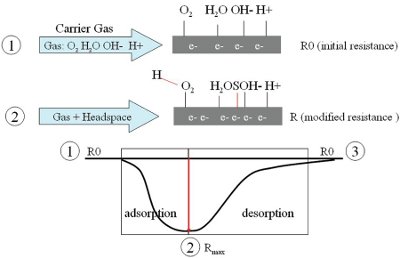
Figure 2 - Working principle of metal oxide sensors.
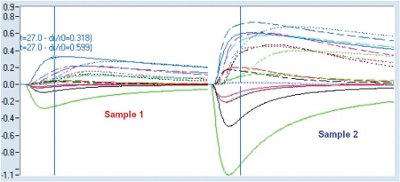
Figure 3 - Metal oxide sensor response.
This application note presents analyses conducted with the FOX E-Nose (Alpha M.O.S., Toulouse, France) on low linear density polyethylene (LLDPE) samples. The objective of this analysis was to optimize a new formulation development, benchmark competitive products, and monitor the manufacturing process.
The instrument measures odors and chemical compounds. The specificity of electronic nose analyzers is that their working principle mimics human olfaction. Instead of measuring and identifying the various compounds responsible for the flavor, as many analytical techniques do, an electronic nose captures the global profile of a flavor/odor.
The FOX E-Nose (Figure 1) is based on a sensor array of metal oxide semiconductors (MOS). Volatile compounds are adsorbed onto the surface of the semiconductors, generating a change in the surface electrical resistance (Figure 2). A specific response is recorded by the electronic interface (Figure 3), transforming the signal into a digital value. Recorded data are then computed based on statistical models.
The instrument can be used to directly analyze the headspace of liquid, gas, or solid samples. Usually, sample headspace is generated by heating the sample in the vial. The E-Nose is used in the food and beverage sector, pharmaceutical industry, chemicals and petrochemicals, plastics and packaging, and in other areas to achieve organoleptic or chemical quality control, quantify target compounds in products, monitor the manufacturing process, and screen large numbers of products during the development stages.
Samples and operating conditions
Table 1 - Operating conditions
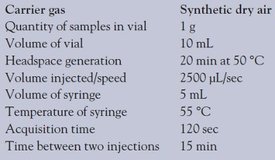
Samples consist of LLDPE pellets collected in production batch and are directly analyzed with the E-Nose without any prior preparation (Table 1). Two samples of LLDPE pellets were collected before (sample 1) and after (sample 2) a critical step of the manufacturing process, known to provide a strong “plastic smell” to LLDPE. Three samples treated with three different amounts of an additive (samples 3, 4, and 5) before undergoing the critical step were also tested. This additive is supposed to “trap” the plastic smell in LLDPE. One sample from a competitor (sample 6), recognized by customers as having a very low odor, was analyzed as a reference product.
Influence of the process and additives on LLDPE odor
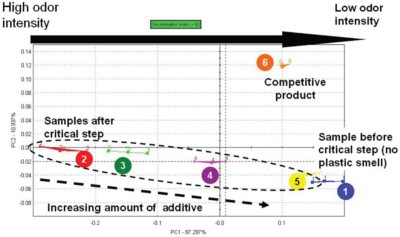
Figure 4 - PCA chart of LLDPE resins with and without additive, and competitive product.
In order to visualize the differences or similarities between various LLDPE resins, data were processed using principal components analysis (PCA) (Figure 4). Based on multivariate treatment, the PCA provides a 2-D representation of various sample odors and chemical composition. The mathematical processing consists of determining two axes accounting for the maximum amount of information. The percentage mentioned below each axis represents the part of the information brought by this axis: in this example, the horizontal axis accounts for the main part of the information (87.297%). The distances between two clusters on the map provide information on the similarity or difference between products. The discrimination index is calculated by dividing the surface of groups by the surface intergroups. It gives the discrimination quality based on an indication of the surface between groups. When groups overlap each other, the discrimination index is negative. When groups are distinct, the discrimination index is positive; the higher this value, the better the discrimination. The arrow in Figure 4 shows the ranking of samples by decreasing odor intensity.
The PCA map (Figure 4) shows a clear differentiation of all LLDPE resins, with a high discrimination index (>90). Samples were classified based on their odor level.
Table 2 - Euclidian distances between LLDPE samples
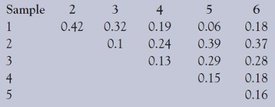
To evaluate the odor differences between resins, the distance between samples can be calculated (Table 2); the higher the distance, the more important the olfactive difference.
The critical process has a clear effect on the odor: sample 1 having no odor (before the critical step) and sample 2 having a strong odor (after the critical step) are quite different (highest distance = 0.42). An increasing quantity of additive has a positive impact by reducing the odor: the distance between sample 1 and samples with additive decreases with an increasing amount of this additive.
With a concentration of 1000 ppm of additive (sample 5), the difference with sample 1 is minimized. Moreover, sample 5 (1000 ppm of additive) is the nearest to the competitive product (sample 6). Therefore, the addition of 1000 ppm of trapping agent allows the manufacturing process of LLDPE resins to be optimized in terms of odor acceptability.
Quantification of additive concentration in resin batches
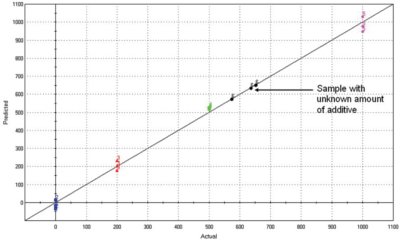
Figure 5 - PLS model for the quantification of additive in resin batches.
In order to rapidly and accurately quantify the amount of additive poured in resin batches during production, a calibration model consisting of partial least squares (PLS) was constructed. This graph presents the known value on the x-axis and the concentration measured by the E-Nose on the y-axis. Each sample was analyzed in three repetitions in order to check the repeatability of the measurement. The higher the correlation coefficient, the more reliable the model.
The PLS model (Figure 5) constructed from LLDPE resins with known amount of additive shows a very high level of correlation (99.46%). This model is thus valid for quantitative analysis and prediction.
Conclusion
From an analytical point of view, the FOX E-Nose is a reliable (RSD <3%), sensitive (low detection limit, i.e., in the ppm range), and fast (analysis in minutes) instrument. In the plastics and packaging industry, electronic nose analyzers are used in:
- Quality control departments to perform batch-to-batch consistency testing of raw materials (resins, pellets) and finished products (caps, closures, bottles, pipes, etc.) and to ensure process conformity
- R&D and marketing departments working on product development to speed up the screening of formulations, select the most consistent raw material, improve the acceptability of the product, benchmark competitive products, or monitor customer claims.
Mrs. Bonnefille is Communication Manager, Alpha M.O.S., 20 ave. Didier Daurat, 31400 Toulouse, France; tel.: +33 5 62 47 64 55; fax: +33 5 61 54 56 15; e-mail: [email protected]. This article is based on a poster presented at EAS 2007, Somerset, NJ, U.S.A.