Characterizing the spectral output
of a diode laser requires
more than simply measuring
the center wavelength with
a wavemeter. The distribution of energy
between different modes will be affected
by temperature and current and may
change randomly. FTIR instruments are
well suited to studying this, combining
high resolution and rapid measurement
with their extremely precise wavenumber
scale derived from the internal HeNe laser. Their high sensitivity allows weak
sidebands to be observed. This article illustrates
the use of the Frontier™ FTIR spectrometer
(PerkinElmer, Shelton, CT)
to characterize the spectral output of a
near-infrared (NIR) diode laser operating
nominally at 785 nm with a peak
width of 0.26 nm.
Experimental
The measurements use a standard NIR
Frontier with CaF2 beamsplitter and
room-temperature near-infrared deuterated
triglycine sulfate (NIR DTGS)
detector. The laser output enters
through the emission port at the back
of the spectrometer, replacing the normal
source. There are two significant
practical considerations because of the
nature of the laser output. The first is
to ensure that the wavenumber scale
is accurate, which requires that the IR
beam fills the Jacquinot stop. This cannot
be taken for granted with a collimated
laser beam as the source. It can
be ensured by aligning the laser beam
to maximize the detector signal and
reducing the Jacquinot stop diameter
until it limits the detector signal. In
this case, the J-stop diameter used was
about 35% of the maximum.
The second issue concerns phase correction.
The very narrow spectral range
of the output means that the interferograms
do not have a large centerburst,
which affects subsequent processing.
Those phase correction methods based
on transforming a short central region
of the interferogram are unsatisfactory
in this situation. With the Frontier,
there are two ways of handling this.
At resolutions of 2 cm–1 and lower, full
double-sided interferograms are generated,
allowing calculation of a magnitude
spectrum, which avoids the
problem. This is not possible at higher
resolutions, which have single-sided
interferograms. Instead, a broadband source
is used to generate a phase correction that
is stored and applied to the laser spectrum.
Results
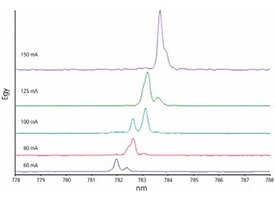
Figure 1 - Typical spectral profiles at different operating
currents.
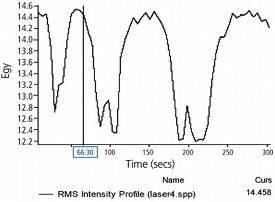
Figure 2 - Root mean square (RMS) intensity variation
of output.
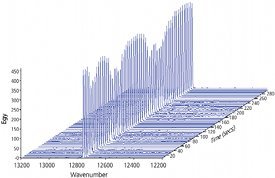
Figure 3 - Variation in spectral profile over 5 min.
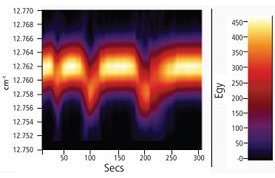
Figure 4 - False color plot showing the frequency shift
over time.
Although the supplier suggests that this laser
diode is suitable for Raman spectroscopy,
the output is distributed between numerous
modes. Figure 1 shows typical lineshapes
as the current was increased from 60 mA
to the typical operating value of 150 mA.
The spectra were measured at 2 cm–1 resolution,
equivalent to 0.12 nm. As the current is
increased, the output increases and becomes
more concentrated in a single mode. However,
the output is not stable. Figure 2 shows
the output with a 150 mA current measured
over 5 min. The peak output varies by over
30%. When the peak amplitude drops, there
is a corresponding increase in the intensity
of the sidebands across a wide wavenumber
range (Figure 3). At the same time, the center
wavenumber shifts by up to 3 cm–1 (Figure
4). This performance indicates that this
laser would be suitable for low-performance Raman spectroscopy only.
Dr. Spragg is an Applications Scientist,
PerkinElmer,
Inc., Chalfont Lane, Seer Green
HP9 2FX, U.K.; tel.: +44 (0)1494 679021;
e-mail: [email protected].