Dielectrophoresis (DEP), the force exerted on a polarizable
particle in a nonuniform electric field, has been used with
great success in recent years to manipulate and separate cells
and biomolecules.1–3 DEP-based microfluidics platforms
have been shown to be capable of separating different
species of microorganisms as well as separate viable yeast
cells from nonviable yeast cells.2,3 A scanning-probe
microscopy technique has been developed in which DEP
forces were incorporated into the feedback mechanism of an atomic force microscope (AFM).4,5 In dielectrophoretic
force microscopy (DEPFM), an ac field is applied between a
conducting AFM tip and a counterelectrode. The resulting
DEP image yields information on charge mobility and local
capacitance with nanometer-scale spatial resolution.
DEPFM has two distinct advantages over alternative related
dc or quasi-dc electric field-induced force microscopies (i.e.,
electric force microscopy, polarization force microscopy,
etc.) when imaging under aqueous conditions: 1) The peak
potentials accessible by DEPFM are significantly greater, and
2) the ac frequency dependence yields information on
charge mobility. Localized DEP spectroscopy can be performed
by sweeping the ac frequency and recording corresponding
changes in DEP force. Additionally, the nature of
the DEP interactions reduces mechanical tip–sample contact
during imaging. Currently, in situ contact and intermittent
contact (tapping mode) AFM studies of biological systems
are routinely limited by artifacts associated with
tip–sample interactions, including sample deformation/damage6
and surface adhesion. The principles and recent applications
of this technique are briefly reviewed.
The time-averaged DEP force, FDEP(ω), on an isolated particle
as a function of the ac angular frequency is governed by
the following expression.7

In the above equation, ε1 is the electrical permittivity of the
medium, V is the volume of the particle, K(ω) is the
frequency-dependent Clausius-Mossotti factor of the system,
and E is the electric field. K(ω) is a sensitive function of the
polarizability, permittivity, and conductivity of the particle
and the suspension medium.7 For a biological interface such
as a cell or lipid layer, the measured Clausius-Mossotti factor
can be correlated to biologically interesting properties such as
membrane capacitance and surface charge. Since the DEP
force depends on the gradient of the squared electric field, the
field must be nonuniform for there to be a nonzero DEP force.
The field inhomogeneities are particularly large in the region
immediately adjacent to sharp conducting tips such as those
commonly used in scanning probe microscopy. The high spatial
localization of the DEP force can be coupled with the high force sensitivity of AFM to allow DEPFM measurements
with nanoscale resolution under aqueous conditions.
Instrumentation
DEPFM experiments were performed by adaptation of a
commercial Dimension 3100 AFM (Veeco Metrology,
Chadds Ford, PA) operating in the tapping mode. Ti/Pt-coated
AFM tips (MikroMasch, Wilsonville, OR) with
nominal resonance frequencies of 6–8 kHz in water were
used in all experiments. To generate an ac electric field
between the tip and the counterelectrode, the signal output
from a function generator (Agilent Technologies, Palo Alto,
CA) was connected to a conducting tip. The ground lead
from the function generator was connected to an n-doped
silicon wafer. In this configuration, the spacing between the
electrodes (i.e., the AFM tip and the underlying silicon) is
equal to the thickness of the wafer’s oxide overlayer plus the
tip–surface separation (see Figure 1). This configuration
allows for a strong, nonuniform electric field to be established
with a relatively low voltage (e.g., no greater than 10
Vpp). All DEPFM experiments were conducted in ~17 MΩ
resistivity water (NANOpure, Barnstead/Thermolyne
Corp., Dubuque, IA). The range of ac frequencies used was
kept above 50 kHz to kinetically limit the extent of electrolysis
of water at the tip and to prevent interference with the
cantilever motion.

Figure 1 - DEPFM instrument schematic.
When an ac field is established between an oscillating AFM
tip and a sample surface during tapping-mode imaging, the
resulting DEP force alters the amplitude and phase of oscillation
of the cantilever. To maintain constant amplitude of
oscillation, the AFM feedback mechanism subsequently
adjusts the height of the cantilever above the surface. In this
way, changes in the DEP force can be measured as phase
shifts in the cantilever motion and/or as field-induced
changes in apparent image height.
DEPFM of gold islands
An electrically isolated gold pad microstructure was analyzed
via DEPFM (Figure 2). Reactive ion etching was used to
deposit a series of circular gold pads onto a Si/SiO2 wafer. The
electrical pad was embedded within an oxide film and electrically
isolated from the underlying Si substrate, complicating the use of more traditional scanning probe imaging
techniques that require a complete electrical circuit
with the sample.
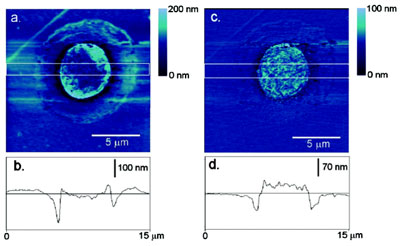
Figure 2 a) - Topography, b) topographic cross-section, c) DEP force map, and
d) DEP force cross-section of a gold island embedded in silica imaged in water with
an 8-Vpp, 25-MHz ac field.
From the image cross-sections, it can be seen that
the resulting DEP force map does not directly track
the topography of the sample. The averaged cross-section
of the gold island shows a flat plateau ~20 nm
above the surrounding oxide layer in the DEP force
map. The topography indicates a curved surface that
does not extend significantly above the oxide layer.
However, the image contrast arising in DEPFM
reflects the dielectric properties of the underlying
sample. Since the gold pad was significantly more
polarizable than the silica in which it was embedded,
it is reasonable to expect an average increase in DEP
force over the gold region, consistent with the experimental
observations.
Interestingly, at small scales (~30 nm) substantial differences
in the DEP force can be seen across the gold sample. The
image contrast is intimately related to local changes in topography
across the gold. The topography of a conductor represents
an isoelectric surface. Consequently, the curvature of the
surface affects the local field gradient, and correspondingly the
distance dependence of the DEP force. Convex features on the
gold pad with length scales comparable to the radius of curvature
of the tip resulted in maximum damping in the amplitude
of oscillation, appearing as larger apparent DEP forces.
Reduction of mechanical tip–surface contact
Detailed analyses of the topographs acquired in the presence
and absence of the DEP force provide compelling evidence supporting
DEPFM as a noncontact imaging modality capable of
routine operation under aqueous conditions. The field dependent
forces adjacent to a polarizable surface (or within a
polarizable medium) are relatively long range (~1/distance2). A
detailed study of the power spectral densities of DEP force maps
and the correlation between those force maps with their corresponding
topographs has shown that the presence of a DEP
force greatly reduces tip–sample mechanical interactions.5
When a rough porous silicon surface (root mean square [RMS]
roughness ~10 nm) was imaged with DEPFM, the resulting
power spectral density (PSD) of the image showed a decrease in
spectral amplitude at high frequencies when compared with the
PSD of the complementary topograph (Figure 3a). This preferential
loss in high spatial frequencies is consistent with an effective
increase in the tip radius of curvature.

Figure 3 a) - Relative difference in PSD between two 1 μm × 1 μm
topographs of a porous silicon substrate acquired with no applied field,
shown offset by 20%. b) Difference in PSD observed upon application of
a 7-Vpp, 100-kHz ac field (adapted from Ref. 5). c) Relative difference
in PSD power density between two 1 μm × 1 μm topographs of a porous
silicon substrate acquired with a dulled (through repeated use) AFM tip
and a sharp AFM tip.
Similar effects were observed when the topograph of a porous
silicon surface acquired with a sharp AFM tip was compared
with an image acquired with a dull tip (Figure 3b). These results
provide evidence supporting the ability of the instrument to
maintain feedback for imaging with the average position of the
tip ~10–20 nm away from the surface. Compared to alternative
noncontact imaging techniques, such as electrostatic, magnetic,
and polarization force microscopy, DEPFM has the added
benefit of being broadly applicable under aqueous conditions.
DEPFM of biological samples
A DEPFM image and complementary topograph of an
Escherichia coli bacterium taken with a 5-Vpp, 100-kHz signal
are shown is Figure 4. These images were taken under
aqueous conditions using a Si wafer as the counterelectrode.
The E. coli DEP force map showed a uniform
increase in apparent height over the surface of the cell,
consistent with relatively simple cell models predicting
homogeneous internal polarizabilities.7 These measurements
demonstrate that DEPFM can be reliably performed
on living systems under aqueous conditions, suggesting
new possibilities for ultrahigh-resolution biological
microscopy using dielectric properties for image contrast.

Figure 4 a) - Topography, b) topographic cross-section, c) DEP force map, and
d) DEP force cross-section of an E. coli bacterium imaged with a 5-Vpp, 100-kHz ac
field (adapted from Ref. 4).
Conclusion
DEPFM affords analysis of the dielectric properties of
nanoscale electronic and biological systems with the
high spatial resolution typical of atomic force
microscopy. The reduced tip–sample contact minimizes
the sample damage/deformation that is commonly observed
when soft surfaces are imaged with AFM. Currently, there are
few alternative scanning probe microscopy techniques that are
capable of facile noncontact imaging in aqueous media, despite
the growing interest in scanning probe analyses of biological systems.
In cells, the information acquired in DEPFM experiments
is unique from the topography and can be related to functional
properties of cells and cell membranes. Because DEPFM experiments
can be performed in water and in the tapping mode, this
technique should prove to be a simplistic method for the in vitro
imaging of cells and lipid layers. In addition, the instrumental
modifications to standard scanning probe microscopes required
for performing DEPFM are remarkably straightforward.
References
- Pethig, R.; Markx, G.H. Applications of dielectrophoresis in biotechnology. Trends Biotechnol. 1997, 15(10), 426–32.
- Markx, G.H.; Dyda, P.A.; Pethig, R. Dielectrophoretic separation of bacteria using a conductivity gradient. J. Biotechnol.1996, 51(2), 175–80.
- Markx, G.H.; Talary, M.S.; Pethig, R. Separation of viable and non-viable yeast using dielectrophoresis. J. Biotechnol. 1994, 32(1), 29–37.
- Lynch, B.P.; Hilton, A.M.; Doerge, C.H.; Simpson, G.J. Dielectrophoretic force microscopy of aqueous interfaces. Langmuir2005, 21, 1436–40.
- Hilton, A.M.; Lynch, B.P.; Simpson, G.J. Reduction of tip–sample contact using dielectrophoretic force scanning probe microscopy. Anal. Chem. 2005, 77, 8008–12.
- You, H.X.; Lau, J.M.; Zhang, S.; Yu, L. Atomic force microscopy imaging of living cells: a preliminary study of the disruptive effect of the cantilever. Ultramicroscopy2000, 82, 297–305.
- Jones, T.B. Electromechanics of Particles; Cambridge University Press: London, 1995; p 265.
The authors are with the Dept. of Chemistry, Purdue University, 560 Oval
Dr., West Lafayette, IN 47907, U.S.A.; tel.: 765-494-5200; fax: 765-494-0239; e-mail: [email protected].