Cellular energy enables vital activities such as proliferation, differentiation, stimuli response and intracellular signaling. In the form of adenosine triphosphate (ATP), this energy is generated by the two major energy-producing pathways of the cell—mitochondrial respiration (oxidative phosphorylation, or OXPHOS) and glycolysis.
As the scientific questions that depend on measuring functional metabolism have become more significant and broadly applicable, the need for more analytical and physiologically relevant methods to measure metabolic pathways has become more compelling. The ability to examine cellular energy pathways in greater detail provides insight into disease pathology, etiology and overall cell health.
XF Technology from Seahorse Bioscience (Billerica, Mass.) allows the simultaneous, real-time measurement of mitochondrial respiration and glycolysis in a microplate, using live cells. This article describes how the technology can be used to examine the multiple parameters of glycolytic activity, in particular, those driven by its primary fuel, glucose, and provides examples of disease research studies. (Note: All XF kits and instruments mentioned herein are from Seahorse Bioscience.)
Overview of glycolysis
Virtually all cell types utilize glycolysis for the breakdown of glucose and production of energy and various intermediates. As described by the Embden-Meyerhof-Parnas pathway, glycolysis involves 10 sequential reactions that follow the breakdown of glucose to generate products such as protons and pyruvate, which can then be converted to lactate.1
Glycolysis measurement traditionally involved end-point biochemical assays that predominantly use fluorescence-based detection. These assays provide low resolution, do not offer a comprehensive picture of metabolic pathway utilization and elucidate only one parameter at a time. With XF Technology, both pathways can be measured simultaneously, as well as analyze each pathway in greater depth. Moreover, researchers do not need to use multiple instruments, hazardous chemicals and compounds, high sample numbers, or spend hours performing the assay and analyzing the data.
Real-time glycolysis
Cells have distinct metabolic phenotypes that reflect the utilization of both major energy pathways under different conditions. The contribution of mitochondrial respiration and glycolysis to ATP generation and biosynthesis of molecular precursors depends on cell type and culture condition. A comprehensive view of these energy pathways permits researchers to characterize cellular metabolic phenotypes and observe the functional consequences of somatic drug mutations or treatments, allowing further in-depth examination of a single pathway.
The XF Cell Energy Phenotype Test simultaneously assesses glycolysis and mitochondrial respiration under basal and stressed conditions to reveal the metabolic potential of a cell (see Figure 1). Scientists can easily categorize the metabolic phenotype and potential of a living cell under the most relevant in vitro conditions possible.
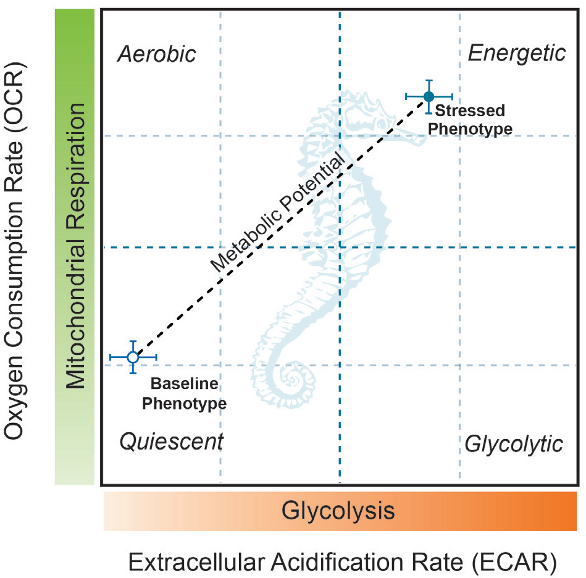 Figure 1 – Baseline and stressed phenotype for the cell of interest as demonstrated by the XF Cell Energy Phenotype Profile. The XF Cell Energy Report Generator further calculates the cell’s metabolic potential.
Metabolic phenotypes between samples are compared using as few as 15,000 live cells. Additionally, the XF Cell Energy Phenotype Test provides the metabolic phenotype and potential in under an hour; generates an XF Energy Map for further analysis; contains quality-controlled, premeasured reagents and a standardized method for conducting the XF Cell Energy Phenotype Test using the XFp Analyzer.
The XF Glycolysis Stress Test further assesses glycolytic activity by measuring glycolysis in real time while inducing acute metabolic stress. This enables differentiation between the basal state, and the capacity of glycolysis to generate energy, or provide precursors for biosynthesis and management of cellular redox. The assay reveals key data that is not evident in an end-point assay. This kit employs single-use reagents to maximize shelf-life, does not require pH adjustment and reagent aliquots and ensures that accurate amounts of reagent are delivered. Similar to the XF Cell Energy Phenotype Test, the dedicated XF Glycolysis Report Generator produces a convenient, customizable data summary that facilitates data normalization and measurement of the key parameters of glycolytic activity—glycolysis, glycolytic capacity and glycolytic reserve (see Figure 2).
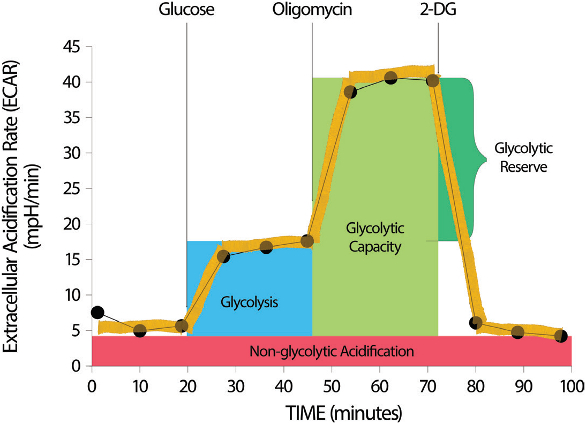 Figure 2 – Cellular glycolytic activity as shown by the XF Glycolysis Stress Test assay. The XF Glycolysis Stress Test Report Generator provides the parameters of glycolysis: glycolytic capacity, glycolytic reserve and glycolysis.
Applications
As glycolysis is a universal process, measuring glycolytic activity is of key importance in many research areas. The utilization of this pathway could indicate a change in cellular proliferation, differentiation or survival. Using XF Technology, researchers are exploring the connection among metabolic pathways and disease states.
Changes in metabolism play an essential role in the progression of degenerative diseases of the central nervous system (CNS), such as Parkinson’s and amyotrophic lateral sclerosis (ALS). Allen et al.2 examined fibroblasts isolated from ALS patients with the SOD1 genetic mutation, which has been identified as one of the most common genetic mutations in familial ALS cases. Using dermal fibroblasts from patients with the SOD1 mutation, the researchers found they could recreate the functional defects observed in the CNS of ALS patients.
Mitochondrial respiration, measured by the oxygen consumption rate (OCR), and glycolytic activity, measured by the extracellular acidification rate (ECAR), were studied in fibroblast cells taken from human skin biopsies in SOD1 ALS patients and age-matched healthy controls.2 The rate of glycolytic activity increased in SOD1 patient fibroblasts with no parallel increase in glycolytic capacity (see Figure 3), suggesting that the fibroblasts were operating at maximum glycolytic capacity. It was concluded that SOD1 patient-derived dermal fibroblast cells switched to glycolysis for ATP production for survival during metabolic stress.
 Figure 3 – ECAR is increased in SOD1-derived fibroblasts. The XF Glycolysis Stress Test reveals increased glycolytic activity in SOD1- derived fibroblasts as compared to healthy controls. The study was conducted using the XF24 Analyzer.
This data highlights the importance of discerning the energy pathways utilized by the cell for survival under normal and stressed conditions. Understanding the interaction of the cellular metabolic pathways and changes during disease can potentially lead to improved treatment strategies.
In cancer cells, the conversion of glucose to lactate in the presence of ample oxygen is called aerobic glycolysis, or the “Warburg effect,” and is often referred to as a hallmark of the disease. The alteration in the cells’ metabolic pathway allows for their growth and proliferation.3
Baek et al.4 evaluated lactate transporters in pancreatic ductal adenocarcinoma (PDA), which has a poor survival rate. The authors reasoned that, because lactate production from glycolysis is readily adopted by cancer cells for survival, disrupting the function of a key lactate transporter might inhibit pancreatic cancer cell viability and growth. Using the XF24 Analyzer, the researchers tested several human pancreatic adenocarcinoma lines, including PL45, Capan-2 and MIA PaCa-2. The XF Glycolysis Stress Test was used to quantify the effect of MCT4, a key lactate transporter, on glucose metabolism. Endogenously high levels of MCT4 indicated a metabolic subtype, in which cells are dependent on this specific transporter to maintain glycolytic activity. It was concluded that MCT4 serves as a key marker and determinant of the metabolic state associated with aggressive cancer. The study illustrates the metabolic pathways influenced by MCT4 and supported cancer growth and proliferation.
New areas of investigation, such as immunometabolism, that focus on a multidisciplinary approach to disease research are emerging. The interactions between the immune system and cellular metabolism suggest a connection that underlies one or several disease pathogeneses, a research avenue that offers significant therapeutic promise.
For example, Gerriets et al.5 studied murine CD4+ T-cell populations to determine whether metabolic programming affects activation, differentiation and function of CD4+ T-cell subset populations, specifically CD4+ effect T-cells (Teffs) and regulatory T-cells (Tregs). Teffs mediate immunity and inflammation, while Tregs suppress Teffs to prevent excessive inflammation. A balance between these cell populations is critical to maintaining immunological protection.
In this study, the authors used the XF24 Analyzer, XF Glycolysis Stress Test and XF Cell Mito Stress Test to assess the metabolic phenotypes and functions of each T-cell subset. The XF Glycolysis Stress Test revealed the metabolic phenotype of Teffs (see Figure 4). The authors observed that the differences in metabolic phenotypes and fuel utilization capabilities can influence cell proliferation and function within the adaptive immune system. Studying the differences between these T-cell populations, including metabolic phenotypes and signatures, may allow researchers to identify viable therapeutic targets for maintaining balance or promoting a desired response within the immune system.
 Figure 4 – CD4+ and CD25- T-cells were differentiated in vitro and passaged and cultured with IL-2 to induce Th1, Th17 or Tregs. The XF Glycolysis Stress Test was used to assess glycolytic activity of these different cell populations.
Summary
Because cells use a combination of mitochondrial respiration and glycolysis to satisfy the demands of biosynthesis and bioenergetics, cell metabolism research is best served by measuring both energy-producing pathways to understand how they intertwine with disease progression and immune regulation. Metabolic research has led to breakthroughs in cancer, systemic lupus, obesity, diabetes, stem cell biology and autism, as well as in the use of blood cells as biomarkers. XF Technology allows scientists to examine the balance between the two major energyproducing pathways, presenting a comprehensive view of the cell, and thus completes and enriches any area of research.
References
- Divakaruni, A.S.; Paradyse, A. et al. Analysis and interpretation of microplate-based oxygen consumption and pH data. Methods Enzymol. 2014, 547, 309–54.
- Allen, S.P.; Rajan, S. et al. Superoxide dismutase 1 mutation in a cellular model of amyotrophic lateral sclerosis shifts energy generation from oxidative phosphorylation to glycolysis. Neurobiol. Aging 2014, 35(6), 1499–1509.
- Wu, M.; Neilson, A. et al. Multiparameter metabolic analysis reveals a close link between attenuated mitochondrial bioenergetic function and enhanced glycolysis dependency in human tumor cells. Am. J. Physiol. Cell Physiol. 2007, 292(1), C125–36.
- Baek, G.; Tse, Y.F. et al. MCT4 defines a glycolytic subtype of pancreatic cancer with poor prognosis and unique metabolic dependencies. Cell Rep. 2014, 9(6), 2233–49.
- Gerriets, V.A.; Kishton, R.J. et al. Metabolic programming and PDHK1 controls CD4+ T cell subsets and inflammation. J. Clin. Invest. 2015, 125(1), 194–207.
Maya Dubey, Ph.D., is technical content manager, Seahorse Bioscience, 16 Esquire Rd., Billerica, Mass. 01862, U.S.A.; tel.: 978-671-1683; e-mail: [email protected]; www.seahorsebio.com