There continues to be a great deal of interest in the flavanol class of compounds, especially in catechin and epicatechin, which are the monomeric and enantiomer members of the class differing only by the stereochemistry at C3, as can be seen in Figure 1.
 Figure 1 – Flavanol molecule.
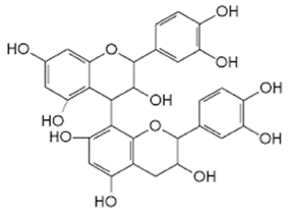 Figure 3 – Example: procyanidin.
The flavanol class of compounds is a member of a larger group of polyphenolics that consists of approximately 5000 compounds divided into six classes (Figure 2). Furthermore, in addition to catechin and epicatechin, the flavanols include larger oligomeric and polymeric forms called procyanidins or proanthocyanidins, as well as condensed tannins (an example is shown in Figure 3). The sample type used in these studies is the basis for a popular treat, and a rich source of polyphenolic and the flavanols content of chocolate and cocoa has been widely studied (with a rather rudimentary Google search on the topic resulting in over 10,000 hits).
 Figure 2 – Polyphenol classes.
Experimental
An HPLC system equipped with a Model QP-8000 quadrupole MS detector (Shimadzu Scientific Instruments, Inc., Columbia, Md.) was used for the analysis. The MS detector was operated in the atmospheric pressure chemical ionization (APCI) negative mode, which resulted in the formation of negative ions. In this study, the MS total ion chromatogram (TIC) and selected ion monitoring (SIM) channels were monitored with the SIM at m/z 289 with the UV trace monitored at 254 nm for completeness. The samples were analyzed as is after extraction with an acidic acetone solution having a composition of 79/20/.5 (acetone/water/TFA). Approximately 1 g of sample was extricated through a process that required 40 mL of extraction solution for 20 minutes using an ultrasonic bath. After the samples were extracted, they were brought up to 50 mL with extraction solvent and filtered prior to use. Twenty-microliter amounts of standard and sample were injected into the HPLC outfitted with a Synergi C-18 (4×25 cm) column (Phenomenex Inc., Torrance, Calif.) with a mobile phase of 80/20/0.1 water/MeOH/TFA (trifluoroacetic acid) flowing at 1 mL/minute..
Results and discussion
The results were calculated by comparing peak areas of standards with peak area of samples. A sample chromatogram can be seen in Figure 4. Additionally, the repeatability of the assay was evaluated on standards and cocoa extracts with CVs of less than 2% with an n of 10. The concentration of the catechin and epicatechin were compared with previous concentrations determined by HPLC with fluorescence detection with comparative data. Several other sample types were examined in these studies with samples of tea and wine seen in Figure 5.
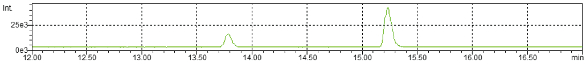 Figure 4 – SIM of cocoa extract at 289.
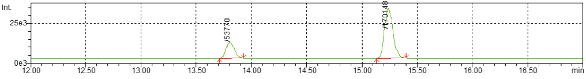 Figure 5 – SIM of grape extract at 289.
Dr. W. Jeffrey Hurst, FAIC, DAAIM, is principal scientist, The Hershey Co. Technical Center, 1025 Reese Ave., Hershey, Pa. 17033, U.S.A.; tel.: 717-534-5145; e-mail: [email protected]; www.hersheys.com