The application of TiO2 as the main photocatalyst on degradation of organic pollutants has been widely investigated. Metal ion doping can retard recombination of photogenerated electron-hole pairs in TiO2 and improve its photocatalytic activity by extending the charge carrier’s lifetime. Indium ion was used as a dopant for TiO2 photocatalyst by improving the crystallite structure and increasing the lifetime of the electron-hole pairs.1-3
Porous TiO2 has a large surface area, highly ordered porous structure and well-defined pore size and porosity.4 Porous material can be used to promote photocatalytic activity and improve the efficiency of photoelectron conversion. The increase in surface area can improve photocatalytic efficiency because of the large surface area exposed to pollutant. The surfactant cetyltrimethylammonium bromide (CTAB) was used as a template agent in the preparation of porous structured materials.5,6 However, there are no reports in the literature regarding use of CTAB to prepare porous indium-doped TiO2 photocatalyst.
In the present work, CTAB was used as a template in the sol-gel method to prepare porous indium-doped TiO2 material. The adsorption capacity and photocatalytic degradation of methyl orange on the material were investigated to assess the enhanced activity.
Materials synthesis
Indium-doped porous TiO2 was prepared by a modified sol-gel method using CTAB as the template. CTAB and 0.0675 g In(NO3)3·4.5H2O (n(In)/n(Ti)=0.03) were dissolved in 8 mL anhydrous ethanol, and then 2 mL tetrabutyl titanate and 0.1 mL concentrated hydrochloric acid were added to the former solution. Another mixture containing 0.9 mL distilled water and 4 mL anhydrous ethanol was then added to the precursor solution under stirring. A gel formed after 1 hour with continuous stirring. The gel was aged at ambient temperature for 24 hours and subsequently dried at 80 oC for 8 hours. The obtained solid was ground and calcinated for 3 hours at 500 oC. The powder samples obtained were ground again and marked as In-TiO2(C), where C (mol/L) represented the concentration of CTAB in the precursor.
Photocatalytic activity
The activity of the In-doped TiO2 photocatalyst was evaluated by methyl orange (MO) decolorization. The mixed solution of MO and photocatalyst [V = 50 mL, C(MO) = 10 mg/L, C(catalyst) = 300 mg/L] was placed in a 100-mL column size quartz reactor. The suspension was stirred for 60 minutes to reach adsorption-desorption equilibrium. Subsequently, a 20-W UV-light lamp with a main irradiation wavelength at 253.7 nm was used as a light source to excite the photocatalytic reaction. The average irradiation intensity striking the reaction solution was 1300 μW/cm2. After UV irradiation for 30 minutes, 5 mL of the suspension was removed and filtrated by a Millipore filter (pore size 0.22 μm) (Millipore, Bedford, MA) to measure the change in MO concentration.
Results and discussion
The photocatalytic activity of indium-doped TiO2 prepared using different concentrations of CTAB is shown in Figure 1. The decoloration efficiency of the dye increases by extending the reaction time on all the samples without an apparent loss of photocatalytic activity. When CTAB concentrations are 0.08 and 0.12 mol/L in the precursor, the sample possesses enhanced photocatalytic activity compared to the sample without using CTAB. Photocatalytic degradation efficiency is 91.8% after 60 minutes of irradiation on the sample In-TiO2(0.12). The degradation efficiency is nearly 35% higher than the sample without CTAB. However, the sample prepared using 0.3 mol/L of CTAB has nearly the same activity as the In-TiO2 sample without CTAB. This means that excessive addition of template CTAB is not beneficial to further activity enhancement. This may be due to the collapse of porous structure in the material using an overly high concentration of CTAB.
 Figure 1 ‒ Photocatalytic activity of In-TiO2 prepared using different concentrations of CTAB.
Figure 2 shows the XRD patterns of In-TiO2 and In-TiO2(0.12). The diffraction peaks of the two samples are in accordance with the diffraction peaks of anatase phase TiO2. There are no diffraction peaks of indium-containing substances such as In2O3 and other phases of TiO2 in the spectra. The addition of template CTAB apparently does not influence anatase TiO2 formation. According to the full width at half maximum analysis of the anatase TiO2(101) diffraction peak and based on the Scherrer formula, the average crystallite sizes of In-TiO2 and In-TiO2(0.12) samples are 13.2 nm and 15.5 nm, respectively. The crystallite size of In-TiO2(0.12) is only a little larger than that of In-TiO2.
 Figure 2 ‒ XRD patterns of In-TiO2 and In-TiO2(0.12).
The X-ray diffraction peaks of (101) crystal plane of the In-TiO2(0.12) sample shift to the lower angle region, demonstrating the cell expansion caused by the addition of CTAB. The addition of CTAB leads to the incremental increase in cell volume, from 0.13616 nm3 of In-TiO2 to 0.13658 nm3 of In-TiO2 (0.12). The CTAB is surrounded by tetrabutyl titanate precursor molecules in the sol-gel process, leading to cell expansion to some extent after the template molecules are burnt out during the calcination process.
The N2 desorption isotherms of In-TiO2 and In-TiO2(0.12) are shown in Figure 3. The volume of N2 adsorbed on the surface increases with increasing partial pressure of N2. The increase in adsorbed N2 is low when the N2 partial pressure is below 0.6, since the N2 molecules are adsorbed on the surface in single or multiple layers. A drastic increase in adsorbed N2 volume appears after the N2 relative pressure is larger than 0.7, which is caused by capillary condensation of N2 in the micropores of the samples. The amount of N2 adsorption on In-TiO2(0.12) is obviously larger than that of In-TiO2. The porous structure produced after the addition of template CTAB is responsible for the larger N2 adsorption capacity on In-TiO2(0.12).
 Figure 3 ‒ N2 desorption isotherms of In-TiO2 and In-TiO2(0.12).
As presented in Figure 4, In-TiO2 and In-TiO2(0.12) samples are composed of micropores and macropores. Micropore size is mainly in the range between 1.5 and 20 nm. There are also macropores in the size range between 2 nm and 20 nm in the two samples. The addition of CTAB apparently does not change the distribution range of the pore size, although the pore volume obviously increases after the addition of CTAB. Micropores in the samples can be regarded as the result of the addition of the template CTAB. Meanwhile, the macropores are mainly interparticle holes coming from particle aggregation.
 Figure 4 ‒ Barrett-Joyner-Halenda (BJH) pore size distribution of In-TiO2 and In-TiO2(0.12).
The average pore sizes of In-TiO2 and In-TiO2(0.12) are 23.3 nm and 16.3 nm, and the total pore volumes are 0.072 cm3/g and 0.22 cm3/g, as calculated using the Barrett-Joyner-Halenda (BJH) method. The total pore volume increases sharply after the addition of CTAB. The specific surface area depends on the particle size and porous structure. Table 1 lists the specific surface areas of In-TiO2 prepared with different CTAB concentrations. The surface area increases for the samples prepared using CTAB as the template. The increased surface area is responsible for the enhanced adsorption capacity. The sample In-TiO2(0.12) can adsorb 8.2% of the initial dye on its surface, whereas only 2.2% of the dye can be adsorbed on the surface of sample In-TiO2.
Table 1 ‒ Specific surface areas of In-TiO 2 prepared with different CTAB concentrations
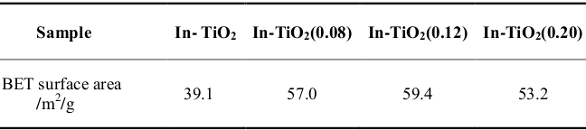
CTAB concentration has a slight effect on the surface area of the samples. The surface area of the In-TiO2(C) samples varies when the CTAB concentration changes from 0.08 mol/L to 0.2 mol/L. The sample In-TiO2(0.12) has a maximum surface area of 59.4 m2/g. However, a further increase in CTAB concentration leads to a slight decrease in the surface area on the In-TiO2(0.20) sample.
Conclusion
In conclusion, 8.2% of the initial methyl orange can be adsorbed after adsorption-desorption equilibrium on In-TiO2(0.12), and 48.2% of the dye can be degraded after 30 minutes of irradiation. The addition of template CTAB does not affect anatase TiO2 formation. The porous structure is responsible for the large N2 adsorption capacity on In-TiO2(0.12).
References
- Zhang, W.J. and Chen, J.L. et al. Chin. J. Mater. Res. 2012, 26, 561–6.
- Mu, J.B. and Chen, J.L. et al. Appl. Mater. Inter. 2012, 4, 424–30.
- Chen, L.C. and Huang, C.M. et al. Chem. Eng. J. 2011, 175, 49–55.
- Arconada, N. and Dura, A. et al. Appl. Catal. B, 2009, 86, 1–7.
- Casino, S. and Lupo, F.D. et al. J. Alloys Comp., 2014, 594, 114–21.
- Mohamed, M.M. and Al-Sharif, M.S. Appl. Catal. B 2013, 142–3, 432–441.
The authors are with the School of Environmental and Chemical Engineering, Shenyang Ligong University, Shenyang 110159, P.R. China; tel.: +86 24 24680345; e- mail: [email protected].