The development of analytical methods in the Quality by Design (QbD) framework is currently gaining great momentum in the pharmaceutical industry. Presented here is a case study in which a pharmaceutical Quality Control (QC) method was developed using HPLC. The possibilities of continuous improvements during the method’s lifetime are demonstrated by switching to ultrahigh performance liquid chromatography (UHPLC).
QbD for analytical methods
Several regulatory approved analytical methods used for QC and release testing have deficiencies and can be improved. Continuous improvements will increase the quality of QC methods and further secure an accurate release testing process of finished manufactured product batches.
Today, modifications of regulatory approved analytical methods without interaction with regulatory agencies are limited. Therefore, the pharmaceutical industry must handle defective analytical methods within what is written in the submitted files. Changes outside the presented ranges cost time and money because official variations must be submitted even for minor modifications of regulatory approved analytical methods.
 Figure 1 – Step-by-step representation of the QbD approach presented in the ICH Q8 guidelines.2
A future vision is regulatory acceptance for making minor changes to approved analytical methods with a minimum of regulatory interaction. Additional work and results generated when modifying a regulatory approved analytical method could be managed within cGMP, i.e., records (from performed experiments) should be stored (according to archive guidelines) and should also be highlighted at regulatory inspections. Recent discussions suggest that the next ICH topic might be the “Analytical Quality by Design” approach, either as a full ICH topic or a reflection paper focused on method validation and/or lifecycle management.1
A QbD approach is outlined in the ICH Q8 guideline2 for analytical method development and is summarized in Figure 1.The first step is to define the method goals and select an appropriate analytical technique. In the second step, the method is developed with validation of the method Analytical Target Profile (mATP). A control strategy is then employed to confirm that the method delivers over time. The final step is continuous improvements.
The overreaching aim of this project was to develop a QC method using QbD principles and show how this method can be improved by switching from HPLC to UHPLC. To do this, the differences between HPLC and UHPLC were studied in depth.3,4 The important proton pump inhibitor esomeprazole, which is the active ingredient in the drug Nexium® (AstraZeneca, Mölndal, Sweden), was chosen as the case study. Here, the authors summarize the most important results and discuss them with regard to method development in the QbD framework.
HPLC vs UHPLC: differences and similarities
 Figure 2 – Chromatograms of HPLC (red) and UHPLC (blue) separations in the quality control method for esomeprazole (highest peak) and its four impurities. The mobile phase was acetonitrile:phosphate buffer with pH 8.0 applied in gradient modes. The HPLC column was an XBridge C18, 100 × 4.6 mm, 3.5-μm column, and the UHPLC column was a BEH C18, 50 × 2.1, 1.7-μm column, respectively. All extra-column volumes were corrected for. (Columns from Waters Corp., Milford, MA.)
Switching from HPLC to UHPLC is usually more complicated than just rescaling a method for different column dimensions. This is exemplified in Figure 2 for a mixture of esomeprazole and four of its known impurities. The gradient time, isocratic hold, injection volume, and volumetric flow rate were scaled according to the vendor’s recommendations,5 and all extra- column volumes were corrected for. Still, the chromatograms from HPLC and UHPLC do not overlap. To understand and explain this difference, the fundamental differences between HPLC and UHPLC operation modes need to be studied:
- In UHPLC, the particle size of the column packing material is smaller than in HPLC. This allows for shorter columns, which can be operated at higher flow rates with preserved column efficiency.
- Due to the smaller particles, the pressure needed to pump the mobile phase through the column needs to be much higher in UHPLC than in HPLC.
- The high pressure in turn gives rise to a temperature gradient in the column due to the frictional heating caused when the mobile phase is forced through the column. This is partially reduced by using narrower columns.
 Figure 3 – Calculated temperature profiles—in both radial and longitudinal directions—for the UHPLC column (BEH C18, 50 × 2.1, 1.7 μm) under high-pressure operations.
Since the reduced particle size per se had a minor effect on the chromatography, only points 2 and 3 are discussed here. Esomeprazole, together with three other compounds with different properties, were studied to make the investigation more general.
To study the generated temperature gradient along the column, external temperature sensors were attached on the surface of the column. These temperature readings were used to calculate the complete temperature profile in the column.6 The temperature profile for theUHPLC column at close to 1000 bar is shown in Figure 3. For the 50 × 2.1 mm column the axial temperature gradient is 3.2 °C/cm, while the radial temperature gradient is about 14.3 °C/cm.
To see how this temperature affects the separation, retention factors for several components were investigated at different temperatures (see Figure 4a).
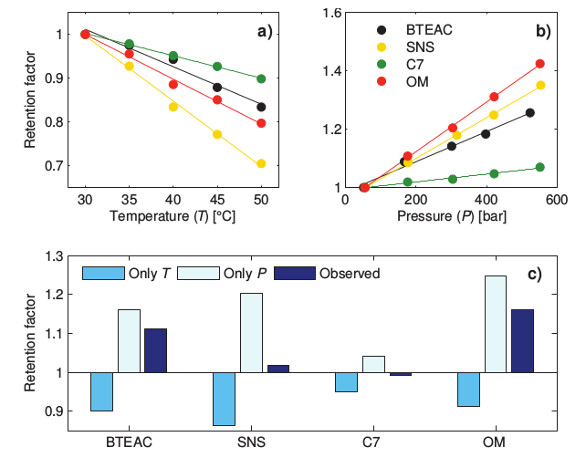 Figure 4 – Retention factor as a function of a) temperature and b) pressure for the probes benzyltriethylammonium chloride (BTEAC), sodium 2-naphtalene-sulfonate (SNS), cycloheptanone (C7), and esomeprazole (OM). c) Based on the temperature profiles in Figure 3, the relative impact of temperature and pressure have been estimated and compared to the observed experimental result of the combined effect of pressure and temperature.
In all the experiments, the flow rates were kept low to minimize the pressure and any temperature gradients over the column. The compounds have different temperature dependence and are therefore affected differently in the event of a temperature gradient; therefore properties like selectivity may also be affected by temperature gradients.
The pressure was investigated by installing a pressure restrictor after the column, which enabled a large, nearly constant pressure inside the column at low flow rates where the temperature gradients were negligible. Changes in retention due to pressure are seldom mentioned when discussing method transfer from HPLC to UHPLC. This is unfortunate because, as shown in Figure 4b, the increase in retention due to pressure was well above 20% for all three charged solutes.
To compare the relative strength of the pressure and temperature contributions on the overall retention time if the separation were conducted at operational flow rates, the individual contributions from temperature and pressure were estimated from Figure 4a and b. The temperature gradients in Figure 3 were used to determine the temperature effect. In Figure 4c, the retention factors have been normalized against the respective retention factor at a low flow rate, where the temperature and pressure effects are small. The bars denoted “observed” represent the observed retention factors in UHPLC standard operation, while the bars denoted “only T” and “only P” are the individual effects of temperature and pressure, respectively. From Figure 4c we see that the temperature effect decreased the retention factor while the pressure effect increased the retention. The most important conclusion from Figure 4c is that the effects from temperature and pressure will always be convoluted and the observed behavior is dependent on the substance.
Design space considerations in QbD
The design space is an integral part of the QbD approach. The term “design space” connotes the experimental region (gradient, column, temperature, etc.) where the analytical method is validated and is shown to be robust, i.e., the range of operator parameters for which the method is filed and regulatory approved.
Today, only changes within the approved “design space” are accepted. However, it is impossible to include future instrumentation in a design space because future technology cannot be predicted. For example, it was not possible to create a method that applied to both HPLC and UHPLC before UHPLC was commercially introduced in 2004 by Waters Corp.
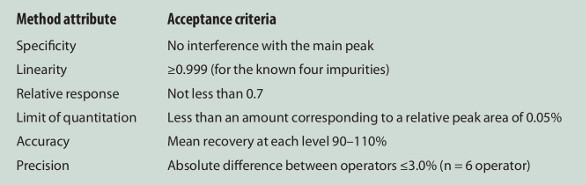
The authors’ vision is that the method analytical target profile (mATP, see Figure 1) is approved for a method, and then it is up to the user to choose a technique and through careful validations show that it meets the mATP. This vision is demonstrated for the QC method of esomeprazole. The mATP, which is the same forHPLC and UHPLC, is presented in Table 1. The QC method must satisfy the mATP and this is confirmed by validating it with regard to each method attribute.
Table 1 – Method Analytical Target Profile (mATP)
In this particular case, buffer pH, temperature, and mobile phase composition were identified as critical factors for the robustness of the method. These were simultaneously varied in an experimental design, and the resolution factor between the two closest eluting peaks was used as the response. The contour plot for the two most important factors, temperature and pH, are shown for both the HPLC and the UHPLC methods in Figure 5. Observe that the HPLC method does not fulfill the resolution requirements below the dashed white line in Figure 5.
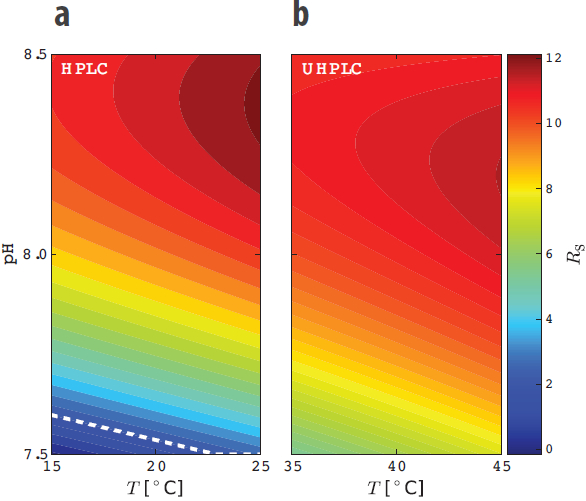 Figure 5 – Contour plots of the resolution factor (Rs) between the two closest eluting peaks in the investigated design space for a) HPLC and b) UHPLC, respectively, for the esomeprazole QC method. Rs is smaller than 2 below the dashed white line (cf. a).
Summary
The possibilities and limitations of the QbD approach in the development of a regulatory approved analytical method are discussed with a case study of a pharmaceutical QC method as a basis. The authors envision a regulatory approved analytical QC method that can be continuously improved, even with minor changes outside the original design space, which is not yet possible. This is demonstrated by switching from HPLC to UHPLC using the same mATP for both methods. To make such a change possible, a scientific understanding of the differences between HPLC and UHPLC is essential. Method transfer in QbD is feasible for analytical methods and will enable better, more efficient, and continuous improvements for future methods.
References
- EFPIA Technical Development and Operations Committee (TDOC), held 21 May 2014.
- International Conference on Harmonization of Technical Requirements for Registration of Pharmaceuticals for Human Use; ICH Harmonized Tripartite Guideline, Pharmaceutical Development Q8(R2).
- Åsberg, D.; Leśko, M. et al. Method transfer from high-pressure liquid chromatography to ultra-high-pressure liquid chromatography. I. A thermodynamic perspective. J. Chromatgr. A 2014, 1362, 206-17; doi: 10.1016/j.chroma.2014.08.051.
- Åsberg, D.; Leśko, M. et al. Method transfer from high-pressure liquid chromatography to ultra-high-pressure liquid chromatography. II. A kinetic perspective. J. Chromatgr. A 2014, submitted.
- Guillarme, D.; Nguyen, D.T.T. et al. Method transfer for fast liquid chromatography in pharmaceutical analysis: application to short columns packed with small particle. Part II: gradient experiments. Eur. J. Pharm. Biopharm. 2008, 68, 430–40.
- Kaczmarski, K.; Gritti, F. et al. Modeling of thermal processes in high pressure liquid chromatography: II. Thermal heterogeneity at very high pressures. J. Chromatogr. A. 2009, 1216, 6575–86.
Dennis Åsberg, Jörgen Samuelsson, and Torgny Fornstedt are members of INTERACT, a large research group at the Department of Engineering and Chemical Sciences, Karlstad University, SE-651 88 Karlstad, Sweden; tel.: +46 54 700 1960; fax: + 46 73 271 28 90; e-mail: [email protected]; www.kau.se/en. Anders Karlsson is with AstraZeneca R&D, Mölndal, Sweden. Krzysztof Kaczmarski is with the Department of Chemical Engineering, Rzeszów University of Technology, Rzeszów, Poland. The authors are grateful to Waters Corp., which provided an ACQUITYTM UPLCTM H-Class system with support and technical advice during the project, as well as the columns that were used. This work was supported by the Swedish Research Council (VR) in the project “Fundamental Studies on Molecular Interactions Aimed at Preparative Separations and Biospecific Measurements” (grant no. 621-2012-3978).