Sappan Lignum, the dried heartwood of Caesalpinia sappan L, has been used as an herbal medicine since ancient times.1 Sappan Lignum promotes blood circulation; removes blood stasis; reduces swelling, pain and inflammation; protects against cancer and immunosuppression; and lowers blood cholesterol. Protosappanin B, a type of protosappanin occurring in Sappan Lignum,2 possesses anti-inflammation and anti-oxidation properties. Thus, the accurate determination of protosappanin B in Sappan Lignum is very important.
HPLC3‒6 and photometry7 have been used in Sappan Lignum analysis. The Chinese Pharmacopoeia also proposed an HPLC method for its quality control.6 HPLC has the drawbacks of low efficiency and high cost. The selectivity of photometry is very low and its operation is tedious and time consuming. Capillary electrophoresis (CE) enjoys the advantages of low consumption of samples and chemicals, fast analysis and high resolution, and has been widely used in herbal medicine analysis.8‒18
After investigating the effects of buffer pH and concentration, applied voltage and organic modifier, a capillary zone electrophoresis method was established for the determination of protosappanin B in Sappan Lignum.
Experimental
Instrumental
CE separations were carried out in a Beckman Coulter (Fullerton, CA) P/ACE MDQ CE system with a photodiode array detector for absorbance measurements at 254 nm. Uncoated fused-silica capillaries were purchased from Polymicro Technologies (Phoenix, AZ). The capillary was 60.2 cm x 50 μm i.d. with an effective length of 50.0 cm. The temperature of the capillary was kept at 25 °C. The CE system was interfaced with a computer and controlled using Beckman 32 karat software (version 7.0).
New capillaries were flushed with 0.1 M NaOH for 20 min, 18.2 mΩ.cm water for 20 min and background electrolyte (BGE) for 20 min. Each day capillaries were flushed with 0.1 M sodium hydroxide for 10 min, 18.2 mΩ.cm water for 10 min and BGE for 10 min. To maintain good repeatability, the capillary was flushed between each separation with water and the BGE for 2 min and 4 min, respectively.
The BGE comprised 30 mM of sodium tetraborate (pH 9.5) containing 8% (v/v) MeOH. The buffer solutions were prepared freshly each day, sonicated for 5 min and filtered through a 0.45-μm membrane filter before use.
Chemicals
Protosappanin B was supplied by the Institute of Materia Medica, Shandong Academy of Medical Sciences, with purity of least 99%.19 All other chemicals, unless otherwise stated, were all of analytical grade. Water of 18.2 mΩ.cm was from a CascadaTM Lab Water System (Pall Life Sciences, Shanghai, China).
A stock standard solution of 2000 μg.mL-1 of the analyte was prepared in MeOH. The working standards were prepared daily by diluting the stock solution with methanol. All solutions were stored in dark containers at 4 °C.
Preparation of Sappan Lignum sample
Sappan Lignum sample was purchased from a local pharmacy in Dezhou, China. It was dried at 60 °C for 6 hr and then pulverized using a mill. Thereafter, 1.0000 g of the powder was extracted with 8 mL of methanol by ultrasonication at room temperature for 20 min, and then centrifuged at 3000 rpm for 10 min. The extraction process was repeated three times. Extracts were combined and diluted to 25 mL with methanol.
Results and discussion
Effects of buffer pH and concentration
Under the condition of 30 mmol.L-1 tertraborate, the effect of buffer pH on the separation was investigated in the pH 7.0‒10.0 range. As shown in Figure 1a, with the increase in buffer pH, the migration time of the analyte increased. At the same time, the peak shape of the analyte was poor when the buffer pH was lower than 9.0. Furthermore, the analyte co-migrated with the other constituent in the sample when the pH was lower than 9.5. As a compromise, pH 9.5 was selected.
 Figure 1 ‒ Effects of a) buffer pH and b) buffer concentration on the migration time of protosappanin B. Conditions: 60.2 cm × 50 μm (50.2 cm to detector) fused-silica capillary. BGE: 30 m
M
Na2B2O7 ‒NaH2PO4 (pH 7.0-10.0) for (a) and 5.0‒40 mM
Na2B2O7 (pH 9.5) for (b). Voltage: 25 kV; detection at 254 nm. Sample: hydrodynamic injection of 100 μg/mL of the analyte for 5 sec at 0.5 psi.Keeping the buffer pH at pH 9.5 and the other conditions the same as the pH optimization, the influence of buffer concentration was investigated in the 5‒40 mmol.L-1 concentration range. As indicated in Figure 1b, the migration time of the analyte increased with increased buffer concentration. At the same time, the analyte was well separated with the other neighboring peak behind it in the sample when the buffer concentration was equal to or higher than 30 mmol.L-1. In consideration of the resolution and analysis time, 30 mmol.L‒1 tetraborate was selected as a compromise.
Effects of applied voltage
The effect of applied voltage on the separation of the analytes was examined in the range of 17‒27 kV at pH 9.5. The results show that the migration time of the analyte decreased with the increase in applied voltage, which resulted in a shorter analysis time. However, when the applied voltage was higher than 25 kV, the baseline noise became apparent, which would result in deterioration of the detection limit. Therefore, 25 kV was selected as a compromise.
Effects of methanol
Methanol (0-10% v/v) was added to the background electrolyte as an organic modifier to improve the separation. As shown in Figure 2, the migration time of the analyte increased with the increase in methanol concentration. Furthermore, the analyte was well separated with its neighboring peak behind it in the sample when the methanol content was equal to or higher than 8% v/v. Thus, 8%(v/v) methanol was added to the buffer solution as an organic modifier in subsequent experiments.
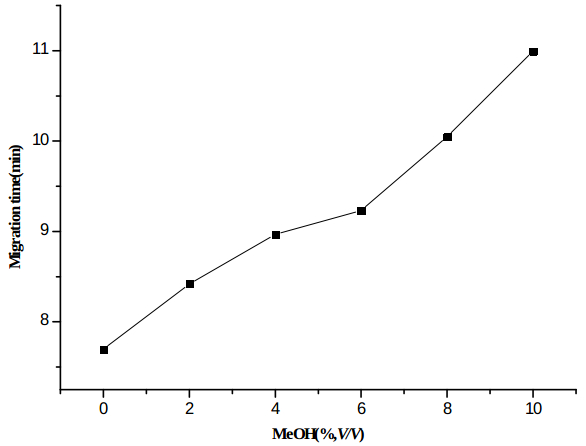 Figure 2 ‒ Effects of methanol on the migration time of protosappanin B. Conditions: 60.2 cm × 50 μm (50.2 cm to detector) fused-silica capillary. BGE: 30 m
M
Na2B2O7 (pH 9.5) with 0‒ 10% (v/v) methanol. Voltage: 25 kV; detection at 254 nm. Sample: hydrodynamic injection of 100 μg/mL of the analyte for 5 sec at 0.5 psi.Analytical characterization
Under the optimized conditions, a good separation of the analyte was achieved in 10 min; the separated electropherogram of standard e is shown in Figure 3a. Linearity of the analyte in standard solution was investigated. The calibration plots were linear in the 0.04‒1.00 mg.mL‒1 concentration range. The regression equations of this curve and their correlation coefficients were calculated as y = 36.27x-16.94 (r = 0.9994). Reproducibility was evaluated by consecutive injection (five times) of a standard solution containing 100.0 μg.mL-1 protosappanin B. The variation in migration time and peak area were 0.57% and 1.74%, respectively. The estimated detection limit, based on a signal-to-noise ratio of 3, was 10.0 μg.mL-1.
 Figure 3 ‒ Electropherogram of a) standard and b) Sappan Lignum sample. Conditions: 60.2 cm × 50 μm (50.2 cm to detector) fused-silica capillary. BGE: 30 m
M
Na2B2O7 ‒NaH2PO4 (pH 9.5) with 8% (v/v) methanol. Voltage: 25 kV; detection at 254 nm. Sample: hydrodynamic injection of 100 μg/mL standard or the sample for 5 sec at 0.5 psi.Sample analysis
The method was applied to determine protosappanin B in Sappan Lignum. The separated electropherogram of the sample is shown in Figure 3b. The content of protosappanin B was 6.4 mg.g-1, which is above what is stipulated by the Chinese Pharmacopoeia6. Accuracy of the method was further verified by adding 10.0 mg.g-1 of the analytes to the extracts of the samples; the average recovery of protosappanin B was 94.0%.
Conclusion
After systematic investigation of the analytical conditions of buffer concentration and pH, applied voltage and methanol concentration, a method was developed for determining protosappanin B in Sappan Lignum by capillary zone electrophoresis. The method is fast and reproducible and has the potential to be used for quality control of Sappan Lignum.
References
- Jiangsu New Medical College. A Dictionary of Traditional Chinese Medicine, Shanghai Science & Technology Press: Shanghai, 1985.
- Zhao, H.; Bai, H. et al. Food and Drug 2010, 12, 176.
- Zhao, H.; Bai, H. et al. West J. Pharm. Sci. 2010, 25, 363.
- Chen, X.; Hu, Y. et al. Chinese J. Anal. Lab. 2012, 31, 98.
- Chen, Y.; Bi, D. et al. China J. Chinese Materia Medica 2010, 35, 2068.
- Chinese Pharmacopoeia Committee. Pharmacopeia of People’s Republic of China (A), Chemical Industry Press: Beijing, 2010; p 153.
- Guo, R.; Zhang, H. et al. Physical Testing and Chemical Analysis, Part B: Chemical Analysis 2004, 40, 213.
- Zhong, H.; Yao, Q. et al. Analyst 2011, 236, 4486.
- Lao, K.; Han, D. et al. Chemistry Central J.2013, 7, 45.
- Wang, H. Lu, Y. et al. J. Pharm. Biomed. Anal. 2012, 58, 146.
- Lu, Y.; Wang, D. et al. Pakistan J. Pharm. Sci. 2014, 27, 487.
- Chen, Q. Li, N. et al. J. Sep. Sci. 2011, 34, 2885.
- Godoy Caballero, M.D.; Culzoni, M.J. et al. Anal. Chim. Acta 2013, 763, 11.
- Cheung, H.Y.; Zhang, Q.F. J. Chromatogr. A 2008, 1213, 231.
- Zhang, Z.; Du, X. et al. Anal. Chem. 2011, 83, 1291.
- Ning, Z.; Zhong, H. et al. Asian J. Chem. 2012, 24, 2965.
- Shi, Q.; Sui, L. et al. Pakistan J. Pharm. Sci. 2013, 26, 1131.
- Lu, Y.; Jia, C. et al. J. Chromatogr. A 2013, 1319, 160.
- Zhao, H. Master’s thesis. Research on active hypoglycemic constituents of Caesalpinia sappan L. Jinan, Institute of Pharmaceutical Science, Shandong Academy of Medical Sciences.
Mr. Sui is an Engineer, Dezhou Environmental Monitoring Centre, Dezhou, P.R. China. Dr. Hou is an Associate Chief Physician, The Dezhou People’s Hospital, Dezhou, P.R. China. Mr. Li and Ms Wang are Associate Professors, Analysis and Testing Centre, Dezhou University, University West Rd. 566, Dezhou 253023, P.R. China; tel.: +86 534 8985552; e-mail: [email protected].